|
|
Post by vespasco on Dec 4, 2014 15:38:52 GMT
Im still working on it but i made a few recordings yesterday !!
I found out my mic on my relatively new phone is pretty screwed too!!
Really bad interefence on all recordings. I will be trying again on a different device.
I also had a chance to ride briefly at WOT in 4th.
Results are not so good actually.
I could pnly manage, again, around 6500 rpm in 4th gear, 7300rpm in all other gears!
Performance is low. It doesnt feel or actually ride like it used to.
Im thinking the even lower, very low exhaust duration could affect this. Yet its ok in 1,2,3rd gears.
From the graphs ive quickly done on MD i get very low results. Which are probably, unfortunately, correct!!? I need to try it on GSF first, to at least get a ball park figure.
Ill send a couple of wavs your way soon sime but quality is not so good.
My pinasco 225 is probably not much faster/powerful than your dr180 sime!!
Ive been getting used to MD more n more. Its getting easier to tidy up spectrums etc. and get closer to gsf.
and the 100kg extra thingy.... I think thats just a co-incidence/bullsht!!
So far, ive been able to get closer to your earlier gsf results sime but i need to get more consistant results to say it works.
Its still Work in Progress!!
|
|
|
|
Post by vespasco on Dec 4, 2014 18:24:51 GMT
A quick add-on.....
Now we're getting closer to achieve constant, reliable results..........
Just to keep everything constant and relevant,
Do you think we should now be using default settings for
Cw = 0.5
and FA = 0.75
?
As GSF and MD use these as their default values.
Which, chances are the apps have both been developed with these settings too.
And , probably, more likely, all other results will be using the same defaults.
Before we had to tweak these a lot to get comparable results.
Check proper dyno graphs stats/results/values against results too. To see what values they tend to use. They're usually printed at the bottom of the graphs.
This means that proper dynos can also be tweaked by changing Cw, F.A. , weight, weather. So take this into account if/when comparing to others' results.
Use proper, likely weight too.
Leave the filter on MD set to Auto
Try not to edit the WAV too much, leave the default and auto settings etc to work their magic.
I will only be using my results to compare against my results, using all relevant default,auto settings, all the time.
I'd say that the final smoothing out of the curve is only ok if it does not have, or has little effect on the final figures (PS and Nm)
|
|
|
|
Post by sime66 on Dec 4, 2014 20:59:55 GMT
I take it those .ps files you sent are produced by MD? They’re just text files to make a graph; not much good to me without the full app or a lot of work – I have to import them into a spreadsheet and plot a graph, in much the same way that GSF produces an ASCII text file, which I can give you, but I don’t think you’d thank me for it!!! – I made proper graphs from the ASCII files for my runs a couple of days ago, but didn’t post them; I might in the morning though. Just out of interest your MD .ps files contain far fewer pairs of data that the GSF ACSII files (which makes them hard to compare directly in this format). I’ve done all four of your runs, vespasco, and got results in PS and Nm for each – you didn’t send GPS data; I’ve done a table; they compare well with each other, but I have no idea what I’m aiming for – we have to agree the best way of showing settings and results that we can all use – graph/text file/jpg/table etc.; it’s a b*st**d scanning back through this thread to find settings or results for each scooter now; they’re scattered all over. (Yes I’m grumpy – I was still trying to fix my computer when your emails arrived; I’m beginning to think it’s an R.I.P. job – time for a new one (there goes my spare engine for playing with). I have graphs for all runs as images and ASCII files, but for now I’m just going to post the front settings page, and the table of summary of results, and one graph and curve to give you an idea of shape (they are all similar). Now, for the purposes of settling on tweaking the settings to make MD and GSF as close as possible, we should pick one of these and polish it in both. We also have mine done in both, and we have pxguru’s in progress in both. Hopefully we can begin to finalise the settings. Now we want to check our scooter-specific settings for each scooter and rider, then check the standard settings for MD and GSF, and hopefully find a method that makes each three of these examples come close in both the app and the software. I think I’ve (GSF) come out high for vespasco, I (GSF) came out high for me, but tweaked it down to be near to expected, but I’ve (GSF) come out low for pxguru. With me and vespasco I think it’s tweaking the settings; with pxguru I want to check the gears and then the settings. It would help if vespasco looked at pxgurus data in either or both too as a cross-check. Here’s your table of results vespasco, and the settings table, and the curve and graph for B (because it’s the fullest curve); it doesn’t matter that this needs a tweak; the cleaned wavs are saved, which is where the work is, but I’d like to agree which of your four we concentrate on. This seems well high to me compared to pxguru’s this afternoon, but I’m not sure why right now. Here they are anyway:     Any posts tonight will be answered in the morning…………. |
|
|
|
Post by vespasco on Dec 4, 2014 21:59:06 GMT
Nice one sime.
I think you are using the overall gear ratio, which for me for eg, (2.83 x 2.24 ÷ 1320 = 4.79) instead of the
gear ratio (2.83 x 2.24) = 6.32 (without tyre size)
GSF inputs tyre size seperately,
MD is included in the in-app gear calculator.
On the files i sent, i ve been getting around 14PS @ around 6300rpm -ish!! Not much really but ok.
This was done by making sure the revs are not reading too high on the final graphs, (eg, no sudden peaks after max revs) as results will be wrong.
Also, on the settings screen, allow more tolerance, 2000rpm - 8000rpm, or in gurujis case 10,000!!
I still cant get your files to read around 9.6PS sime... But the curve and revs look the same.. Thats with 3 x different wav files, so pretty consistant..
From today, i are mostly be using - Auto, Snap feature on, default 0.5 and 0.75
Let the app run in auto as much as possible.
Edit the spectrum using the Snap feature (leave change snap off)
Start scrubbing from the lowest spectrum until snapped green curve is on correct spectrum.
By doing it this way you can fill up any 'holes' you have.
Dont tweak/move the curve of the spectrum,,,,thats just cheating!!
Read the graphs, not the numbers!?
I dont know what happened to those gps files!? They saved as a weird file type.. Anyway, i forgot, you cant use them on the gsf anyway! Just delete them.
My gps readings for the files were 90kmh +\-1
Revs maxed out at 7350 (flittering on 7400rpm)
|
|
|
|
Post by sime66 on Dec 5, 2014 6:42:42 GMT
Right, we’re getting somewhere (SEE 'B Rev1'):  For future wavs, I need the settings with the wav, and if you have results, send those at the same time; it is too time consuming and too prone to error to wade back through this thread to find data for the scooters, riders and weather conditions on different days. I suggest we try to send in this sort of format: Input:
.wav file – attached
.gps file – attached (not needed for GSF, but I’ll send them to MD tweakers if I do more runs)
Weight:
Gear ratio (without tyres):
Tyres:
Temp:
Pressure:
Cd:
Area:
Results:
PS max@rpm:
Nm max@rpm:
Max rpm:
Max speed@rpm:
&
Screenshot of dyno graph(s), not .ps or ASCII files (too time consuming and don’t cross-check easily).If we’re all sending and receiving the same info in the same format it will be simpler and more accurate to pin down the method and the variables. With three lots of data, and the data samples growing, and with GSF and MD results for both, and those results being revised by tweaking, we’re going to get lost unless we keep it standard. Pxguru is only working on his own runs, so far vespasco is working on his and mine, but I’m working on all three and I need it in the way I’ve suggested above to keep track and avoid errors. Pxguru, I’ve got lower results than expected for your test runs; my main suspect at present is your gear ratio; to check that I need you to give me your primary and secondary gears (3rd), so I can work it through. How did you get to 6.604? I can’t really go on to look for the cause until I’ve satisfied that hunch. Vespasco, I can’t comment on how best you tweak MD to get results that tie up with GSF, what I’m best able to do here is give the most accurate GSF results I can to any set of wav and input data you send me (in the above format). I’ve got a method now that makes that a fairly simple job (importing, settings, cropping, cleaning) if I’m given the data in one go, and don’t have to hunt bits of it down back in the thread or email text or PMs, or ask for it again. I can produce graphs, but they aren't much use until the settings are correct, so it's best to get them, and any results you may have, with the wav. From there, when my input and output data are correct; I’m hoping at some stage you come up with a standard method that works within acceptable margins in all cases. Until then, I’m still of the opinion that measuring in MD and working results in GSF is quicker, simpler and more accurate. – I hope to be convinced to part with my £6, but I’m not convinced yet. It may be the case that we each settle on our own way of comparing our own results, with our next set, and just standardise our own method for our own use; at present I think I can most accurately do that with a combination of MD and GSF – each of us might reach a different conclusion, or you might convince me otherwise. I'm glad to see you've withdrawn the dubious 100kg theory too (wasn't pretty). It doesn’t matter now, vespasco, but my hunch is that you sent me the files from the wrong directory. I think you meant to send me .gps files from the GPS directory (which I don’t need in future anyway BTW), but instead you sent me what you called ‘results’, which come from the RESULTS directory; those are .ps (a text file) which are a string of co-ordinates to plot a graph (it’s what MD uses to make graphs). They were not odd or corrupt, they just weren’t the right ones. I can use them to make a graph, like I do with an ASCII file, but it doesn’t really serve any purpose, and .ps don't work in GSF, which uses ASCII .txt. Just to illustrate, I’ll show you what I mean: Here is a screenshot of part of the page of all the ASCII files I created and compiled for the runs I did for rpm graphs (there is another page for time graphs):  Here are the sort of graphs that can be produced, but after I had done them out of curiosity, decided that they served no real purpose other than establishing that they can be done: All values plotted against rpm: All values plotted against time: All values plotted against time: Probably best to leave .ps and .txt (ASCII) files out of it really.
|
|
|
|
Post by pxguru on Dec 5, 2014 8:10:24 GMT
I dont see why GSF and MD are so different. Sent you another wav file to try. On MD this one comes out at 33bhp.
|
|
|
|
Post by sime66 on Dec 5, 2014 8:31:15 GMT
got your emails pxguru: I'll look at the new wav - I have cross checked your gears now (the 22/65 was why I couldn't get same ratio); sadly though it means there's another reason our results are different; anyway more on that later.... To install GSF Dyno, you're best installing Tom's Tuning Tools', which you'll find here: vvvatom007.heimat.eu/tmt/gsf_dyno.html
^^^
Good to have someone using both; I have free MD & GSF and vespasco has MD (on tablet) - I'm also thinking MD on phone screen is ambitious! |
|
|
|
Post by sime66 on Dec 5, 2014 9:32:41 GMT
Pxguru: That is an UGLY wav! However it does give me a clue why our results differed before; there are two curves, a nice one terminating a little over 8,00rpm, and half a curve terminating higher. This second curve gives a much closer PS. Here’s some pictures and results, I need to go back to see if I can find a shabby, higher curve in the first file…………. Raw wav: Low curve (A): Low curve (A): High, weak, half-curve (B): High, weak, half-curve (B): Low curve (A) graph: Low curve (A) graph: High curve (B) graph: High curve (B) graph: You get a better PS, but a distinctly kinky curve and a too-high max rpm; you chose:  NOW quid pro quo, chaps; can one of you two spend five minutes getting me caught up on with the end of this other one; I want to get that out of the way, so I can concentrate on this Dyno thread. NOW quid pro quo, chaps; can one of you two spend five minutes getting me caught up on with the end of this other one; I want to get that out of the way, so I can concentrate on this Dyno thread.
Please, five minutes here:
vespa.proboards.com/thread/4487/cranks-thick-gaskets-squish-timings?page=4 |
|
|
|
Post by sime66 on Dec 5, 2014 10:09:56 GMT
Pxguru: Getting used to your UGLY wavs; found the source of the discrepancy yesterday: UGLY wav: Cropped: Cropped: Bingo! Bingo! Summary: Summary: I’ll let you scratch your head about the high rpms; must do other stuff now. before i go, i'll repeat request for a bit of help on other thread: NOW quid pro quo, chaps; can one of you two spend five minutes getting me caught up on with the end of this other one; I want to get that out of the way, so I can concentrate on this Dyno thread.
Please, five minutes here:
vespa.proboards.com/thread/4487/cranks-thick-gaskets-squish-timings?page=4 |
|
|
|
Post by sime66 on Dec 5, 2014 10:16:52 GMT
|
|
|
|
Post by sime66 on Dec 5, 2014 13:29:16 GMT
Pxguru:Thanks for input on other thread; I’d kept this one up my sleeve because I want to do the same thing for vespasco’s Run B Rev 1. This is based on my suggestion from a couple of days back where we were getting too high revs in my runs, which was: 2nd Dec,
**Use the GPS speed recorded during the run, to calculate (using my lovely gear/speed/rev calculator, for example) the maximum revs for the run. Put the maximum revs in the box on the front settings page. Tick the box “Plot Graphs Only to Vmax”. And Sally’s your Auntie – no more embarrassing 7,400rpm!!**So last go, using precisely your 8,800 rpm as the limit in settings to prevent a dubiously high rpm in the results:  Draw your own conclusions…………… Vespasco:I think this will help your Run B Rev 1 result too, though it will reduce the power result; I just need a quiet moment to go back to it with your 90kmh/,7350-400, which I’ll also cross-check with gear/speed tables. One way or another, I suspect that we’ll get the revs close, but not exact (too high for correct power, or low power for correct revs) – I reckon this is probably to do with recording quality.
|
|
|
|
Post by vespasco on Dec 5, 2014 16:48:00 GMT
I tried last night to update the other thread but my photobucket was taking hours to upload my screenshots.. i had to give up waiting in the end... Ive got a moment on my pc....... i quickly checked my 4 x wav files ( i sent them to you also sime, Marked, 1st,A,B and C.... All 4 wavs produce , pretty much, the same results, on both MD and GSF! Yippee!!! around 14PS...but forgot to screenshot them.... Pxguru jis wav above , in my opinion, is not usable for accurate results, due to the 'split' in the wave.. this will either need smoothing out before you get to the results , or use another WAv file. also, if youre taking readings from above gurujis maximum rev range, this will also bump up the figures considerably. i cant be sure without hearing where the actual gear changes are but youre right, it dont look pretty!! it looks a little its 2nd and 3rd gear made into 1!? plus,it looks like it takes 14 seconds to reach max revs....?? thats quite slow for this motor? id expect it to take no more than 10 seconds, which if you look at the initial curves, its likely the curve that lasts 10 seconds! It should be quite easy to tell, try hitting the play button, to hear where and when the gear changes are. remember, when smoothing out a curve...... the more you smooth it the less accuarte the results will... i suggest using filter no.1 to start with.....if its really spiky (undoubtedly due to the recording and hence the 'steps' in the line) then i would use the next filter, no.2, until i reach a stage where i can see a smooth version of my first result (when using filter no.1) youre not looking to smooth the curve as much a possible,,(by changing filter length), youre looking to smooth the curve as less as possible. ive been getting consistant results by 'scrubbing/cutting' the max revs to where they actually finish...in my case, around 7350rpm. so there are no spikes or sudden peaks.... take no/little notice of the final figures for now, its the graph you need to study...where the peaks are is what you need to look at..... for example, if there are 2 x peaks,,,,by altering the filter, you may end up with vastly different results, as the final readings would be taken from, for example, peak A, which for arguments sake is: 15PS @5000rpm altering filter may move that peak to peak B which, for arguments sake, gives 15.1PS but at @6500rpm.... by altering the filter you end up with almost the same curve but the final results are vastly different... this is what you need to look at closely! Without actually hearing the file, heres what i think you need to use..... 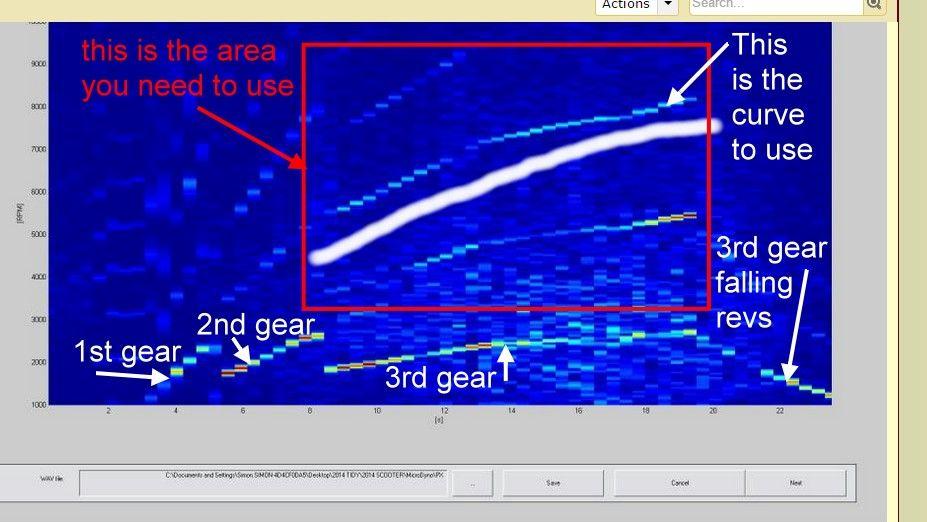 |
|
|
|
Post by vespasco on Dec 5, 2014 16:56:41 GMT
again, heres guru jis wav file..... 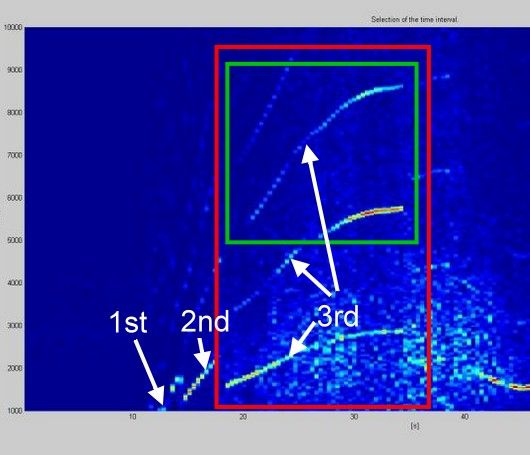 highlighting the area to use |
|
|
|
Post by henri on Dec 5, 2014 20:04:38 GMT
as a aside ,vespaco you said above your feelin the love in 1,2nd,3rd but not gettin ya "bang fo buck " in 4th , that says to me your port timings arent workin with ya exhaust harmonics as it goes high revs/over revs , will be interesting to see wether the re-introduction off a .5mm base packer ,which you use to have ,raises you to the sweet spot , tho with a sip road box maybe ya askin what it cant give ,there tuned/set-up for low-down torque an with the adaptions youve made maybe the lumps fightin the box at higher revs , jus a ideal thought , H
|
|
|
|
Post by vespasco on Dec 5, 2014 21:20:51 GMT
Trying to keep on track with the dyno , ill answer that in 'cranks,squish .....' thread
|
|
|
|
Post by pxguru on Dec 5, 2014 23:13:00 GMT
I'll try to get a few more wav files over the weekend and try to get a cleaner run. They are all showing near to what it actually is I guess you worked out the speeds I was doing on these runs? That last curve was from 22mph to 69mph in thrid (GPS speed), it's a 17 stone guy on a scooter not a Fireblade  On the last run down the bypass it topped out at 8200rpm in 4th, took about 2 minutes to get there though! |
|
|
|
Post by sime66 on Dec 6, 2014 7:37:48 GMT
After a week of data we seem to be gravitating towards GSF for the results now. Going out on scoot in a bit; before I do I thought I’d take stock of data and results – I don’t think I need more wavs for me, and I think I got decent results for vespasco too, so I probably won’t do more test runs in this freezing weather. I will definitely have another bash at your’s pxguru, if you have more sometime. Vespasco, a lot of what you wrote yesterday was stuff I’d already covered; I’ve previously done the curve you highlighted (with and without the tail) and the one above it, and shown my results above, I’ve talked about how the filter affects the results etc., too, so I’m going to hold off tweaking now until I get more data. I’m also to keep this post brief for the same reason. I’ve taken note of both your latest posts, and I may tweak more if I’m bored, but with the weekend here, I’m more inclined to wait for cleaner data than continue playing with these. This is where I’m at with each scooter: I’m not interpreting the results; just comparing my best results with expected where available – I’m showing what I get, whether it’s weird or not). 
We all have GSF now, so should be able to get the same results from a wav. Once we get that, maybe we can go back to finding a method in MD that gives similar results.
It’s nearly daylight; I’m outta here…………………
|
|
|
|
Post by vespasco on Dec 6, 2014 19:29:08 GMT
Another different set of WAVs would be a help, anyone else?
MD is so close.
|
|
|
|
Post by vespasco on Dec 9, 2014 0:45:59 GMT
*Edit: I've added all of the actual results/figures. But i do believe you should be looking at the curve/graph, not the numbers. As for the MicroDyno, im now happy with the results. As for the results, im not so happy with the vespa. Poor thing! These are just some things I've learnt while experimenting with the app. These are not full instructions. They've already been written. Its just my conclusion and tips on how to get the best out of the app...... my goal was to achieve consistant results, good enough to notice any modifications i may do later on. I hope to be able to compare my results i have now to any 'dyno runs' i do later. (After modificstion, tinkering, on the same stretch of road etc etc. . I spent too long trying match the GSF Dyno perfectly. Then i realised i didnt need to, as I will only be comparing my MD results to my MD results! So the numbers do not really matter. The final graph/curve itself is what matters. After several experiments with MicroDyno (MD) I have finally come to a conclusion. It works! To get it to work with consistant, readable results is possible too. Here are some tips; Open the app. Settings. Enter your details as accurately as possible, keeping 'Cw' @ 0.5 and 'Front Area' @ 0.75. Measure your tyre accurately too. Use the in-app Gear Calculator Enter your weather details for even more accurate results. 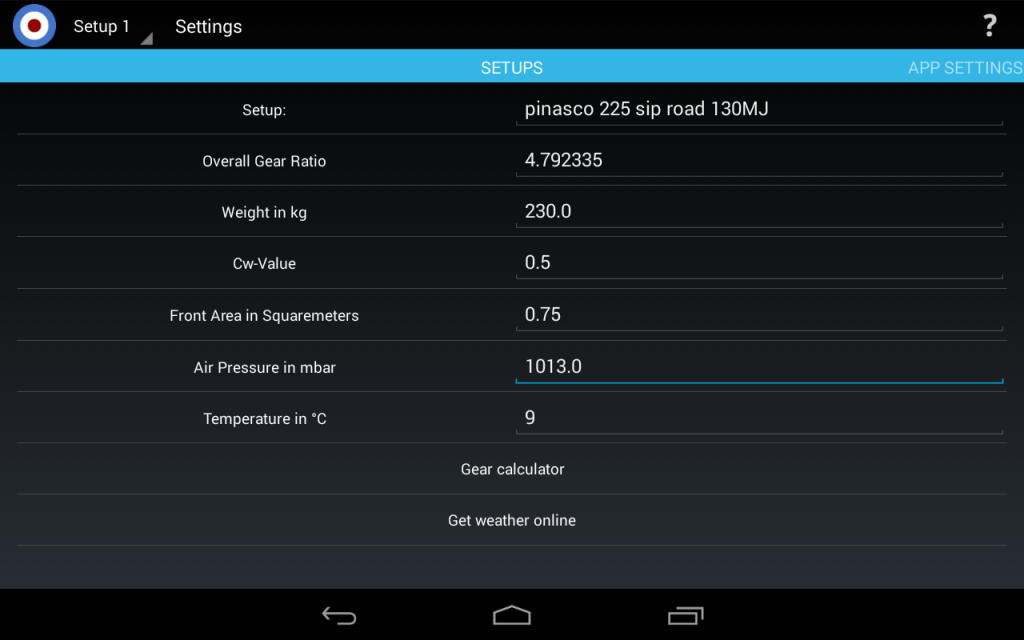 Find a nice, straight road, preferably quiet, with a slight incline is ideal. This is important for accurate results. Going downhill with your chin on the speedo will likely show a lower PS result! Going fast through 1st and 2nd gears, to reach max speed quicker in 3rd will not allow you to obtain a recording starting at under 4100rpm. Prepare to do a few runs either way, up and down the same stretch of road. Next When you hit the 'New Record' button, remember to switch on and wait for the GPS. When recording your 'run', in 3rd gear, start off slowly @ around 3500rpm or lower for a few seconds, to keep the revs constant. Then twist that throttle open as quick as your motor will allow. When its reached max WOT, keep it there for a few more seconds. If possible, make a note of the rpm and speedo readings while your riding too. Pull over somewhere safe. Stop the recording,,,,, etc Repeat 6 times! - 3 x 'uphill', 3 x 'downhill', keeping note of your speedo/ rpm display/s. Getting your (accurate and consistant) results; Find the file. Open it. Editing the WAV file recording. Ideally, trim the recording to around 20 seconds. This is where starting @ around 3500rpm for a few seconds and ending at WOT for a few seconds really helps. It becomes easy. Notice the long straight yellow lines at the beginning and more so at the end. These straight lines are at a constant rev range. 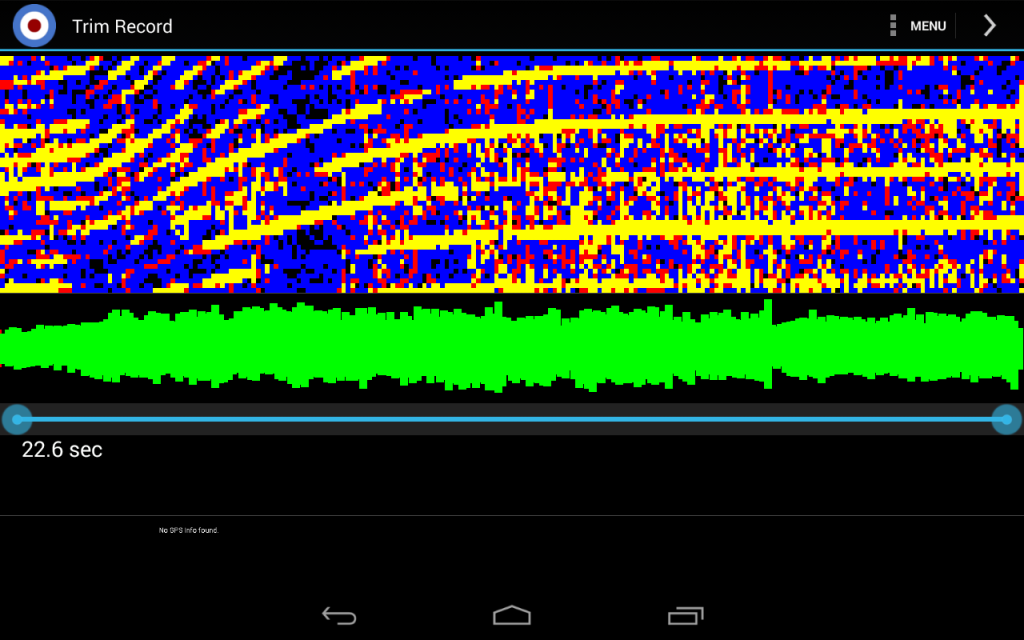 Next. Editing the spectrum frequency: Youll find if you have a good recording without interference, that the rev range you're looking for will auto 'snap' - find itself! Easy! The green line is the one thats used. So check its on the correct rev range/ curve and not suddenly 'peaking' into another curve. Heres the same file opened in the Edit Spectrum Frequency. The green curve has 'auto snapped' to the correct rev range, in this instance around 7400rpm. Notice there are 'gaps' or 'holes' in the yellow frequency curve that you need. These can be fixed. 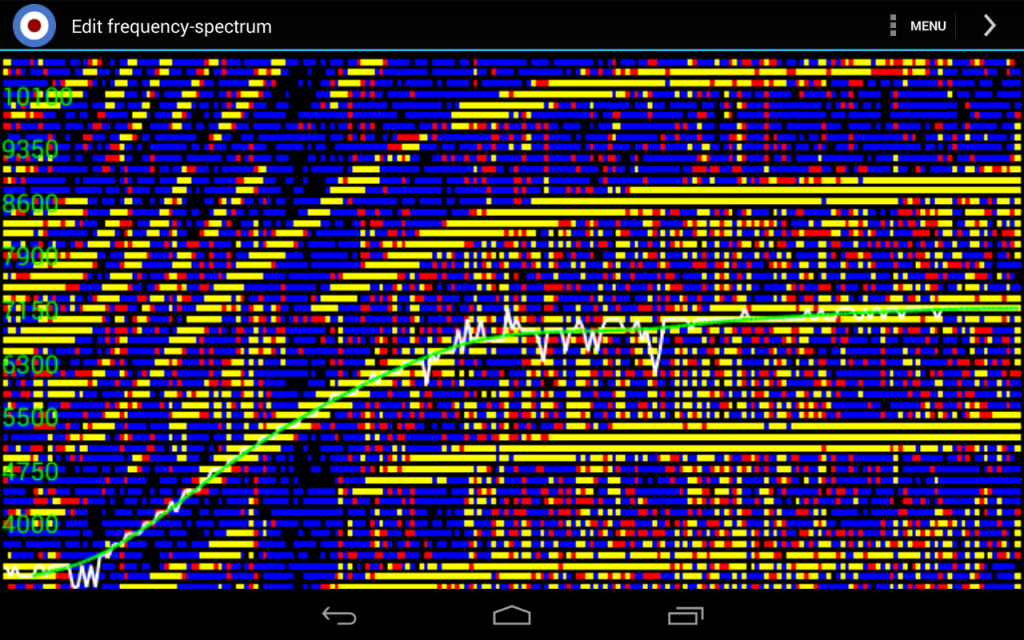 To get more accurate results, 'delete/scrub' any peaks you see on the white line...BUT... DO NOT MOVE the the green line/curve!!! Or at all if you can help it. Otherwise your results will not be very accurate. (Its quite easy to 'push' and 'nudge' the curve higher here, lower there, giving you 'more' (or less) PS. This is obviously not worth doing. Your results will not be reliable or mean too much. If it does not perfectly 'snap' to the currect rev range, heres a tip: In the menu, ensure; Change snap area OFF Auto Snap is ON Auto Filter ON Any gaps or 'holes' in the curve can possibly be filled by deleting some/all other curves, above and below the correct curve, highlighted in the spectrum graph as yellow (shown deleted). 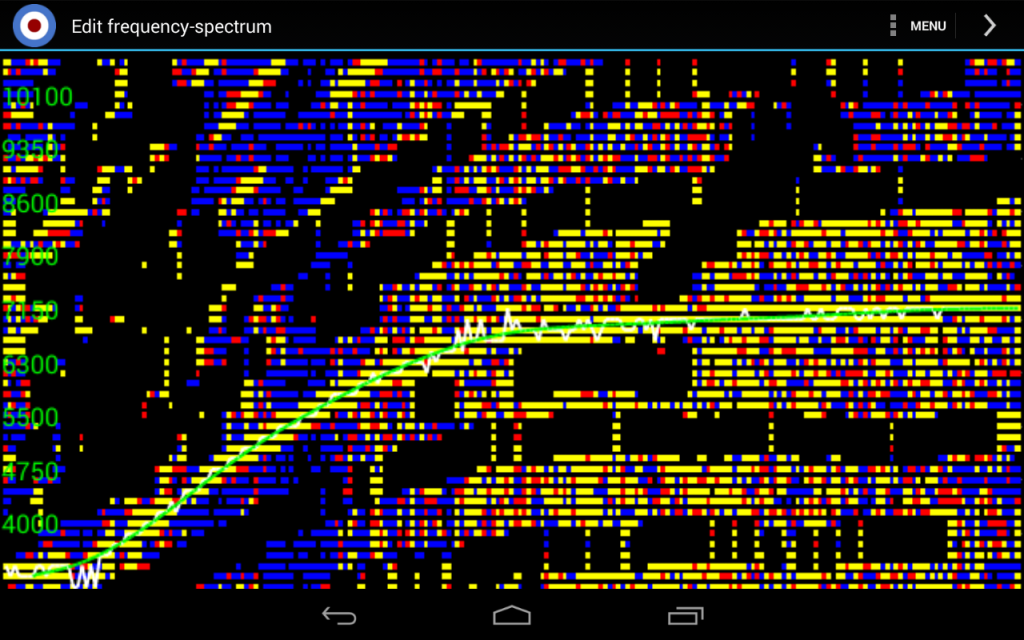 Remember, the more you move that intial green line curve, the less accurate your results will be. If you find its impossible to get the green line to auto snap to the correct curve without it 'leaping' and 'dancing' all over the place then chances are your recording is not so good. Once youre happy with the selected curve, press next! Results! You should see a nice smoothish curve. Not necessarily exactly as pictured below.  To get even more accurate, go into Settings from the menu button. Take note of the filter used (15 - 30) so you can revert back. Turn the auto filter OFF and alter to 15. Now take a look at the graph for a more 'detailed view' of the curve. If its 'peak'ing all over the place, go back to the editing spectrum and tidy up any of those white line peaks you see. Heres with minimum filter length @ 15.... I think it shows where there are any peaks more prominently than a 'typical' smoother curve. 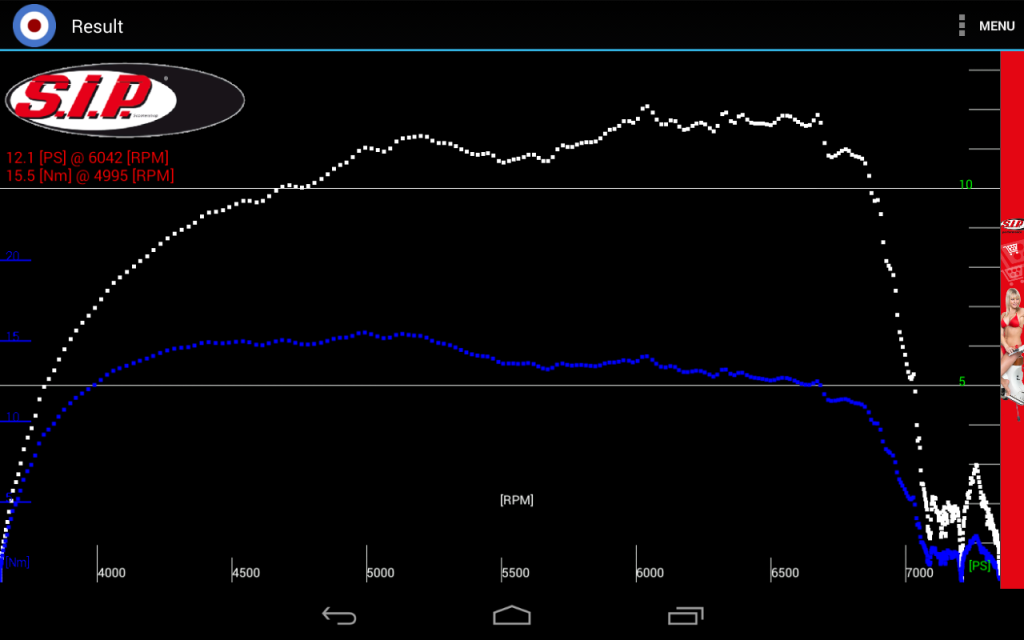 The results above are fairly typical, based on all 10 x recordings i made. Ignoring the figures and looking at the curve only, the torques peak at around 5000rpm. +\-100 (on freak occasions it peaked over 5200rpm). The peak revs on the torque curve was the most consistant reading. The Nm reading itself was typically 16Nm +/- 1Nm, (+2Nm or 3Nm on freak occasions). Hopefully, here are the acual results/figures ![]() The peak revs of PS was also pretty consistant, with the graph always showing it fully maxed out at around 6400rpm. It also shows the initial power band coming on from low revs, upto around 5200rpm, then dropping/keeping steady between 5200rpm - 6400rpm. Then keeping steady/maxed out/falling. Finally dropping out at around 7350rpm. The actual figure for PS does not appear consistant with the GSF Dyno as yet. But ive not got enough data to test that fully. Yet no matter which shape of curve i end up with, whether it be a 'camels hump', or more of a vespa engine side panel shape, or a straight curve going all the way up with a sudden drop at the end, all the graphs when viewed in more detail using filter 15, read consistently accurate enough to extract the info i need.... Which was not how many HorsePower i have but ....where it is....and isn't! The actual final PS seems to read a little low in MD when compared to the GSF Dyno, yet, its just a number! Its the curve that really matters - ie, Where the curve starts, peaks and finishes, its the same with 'the torques'. On the 10 x recordings ive made, using my Pinasco 225, (no base gasket - not so powerful), the torque and rev range where it peaks, is very consistant in MD @ 5000rpm +/-200rpm) As is the peak rpm, although this changed by around 400rpm depending on whether i was going uphill or downhill. Going up or downhill gives varying different PS figures. Although the graph will still be readable and tell you enough info. Id say take the actual figure of PS as you like, i couldnt get enough data together to put that one to rest but all other readings; where peak power is (and isnt) and at what rev range is all accurate as far as i can tell. The final graph will also be a good guide too. Here are the actual figures as recorded in the 10 x recordings. Just for the record. Note a couple of higher Nm runs. These is where i really wound the throttle fully open and just let the engine catch up, up a slight incline. 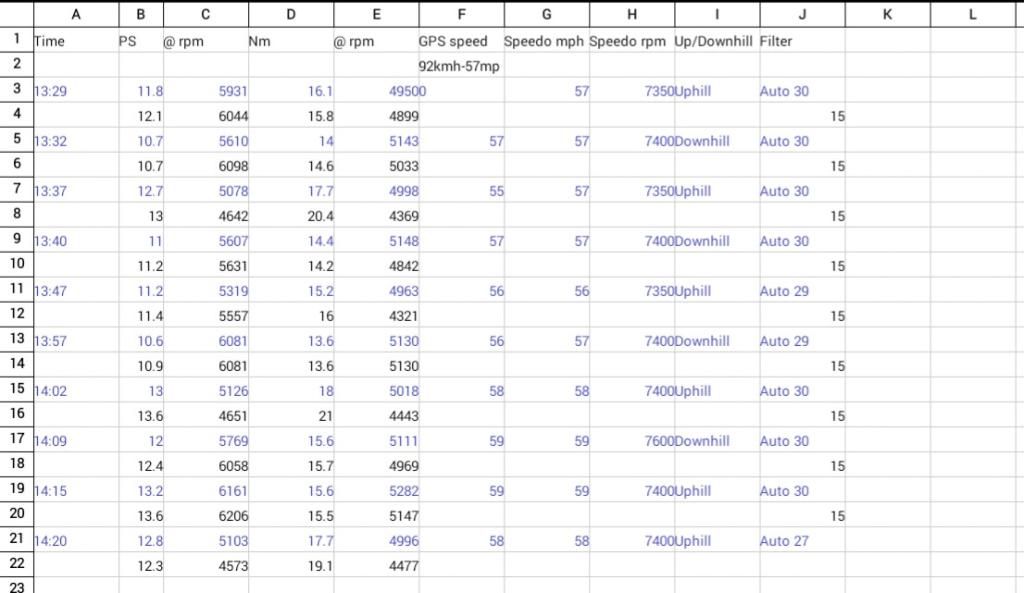 ![]() It all boils down to how good/consistant your recordings are. Following the tips above i believe you can get very usable results. So using the same graph as an example below..... We can see where the peaks are….. So lets say i want to push that first power band further up the rev range... How could i do this without major changes? By altering the height of the cylinder?! So is a "typical 'low blowdown' curve" like a camels hump, pretty even going up and down?! Peaking too early? We have GPS results which we can check against a gear calculator too. |
|
|
|
Post by vespasco on Dec 9, 2014 2:35:11 GMT
And to follow on from gearing thread and the long strokes, gasket, squish thread, heres some relevant info: 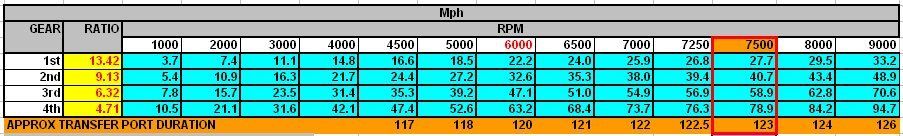 Credit goes to sime for that one  This is my gearing on the same motor as used above. From this i could see: In 3rd gear, all the figures compare well. Almost exactly. Now with the final graph in MD i can see more closely, in more detail, whats going on and where. The dyno results highlighted the problem i have with my loss of power in 4th gear and in good detail too..... In 4th gear, using my well calibrated digi speedo and rev counter as an accurate guide.... @ 3000rpm the gearing calculator (above) matches my digital rpm and speedo readings excatly. @ 4000rpm they also match perfectly **@ 4500rpm, peak torque is coming up and is available in certain conditions. @ 5000rpm my motor is about 0.5mph down on the gear chart above **@ 5200rpm = peak torques @ 6000rpm the motor is 1.5mph down **@ 6500rpm, where my motor peaks out, (more around 6400rpm) no more power, its down by 3mph. @ 7000rpm its down by 4.5mph (It wouldnt reach the 7300rpm / 73mph it used to reach) ** - as shown in the dyno graph. Next is to first tweak my timing, by advancing it as much as it will go without pinging! (Its around 19* at the moment) After that, raise cylinder with a 0.5mm packer. Re adjust timing. Few test runs. Plug readings. Blah! Blah! Woof! Woof! Bobs ya uncle. Spring is here. |
|
|
|
Post by pxguru on Dec 9, 2014 8:10:54 GMT
When we are talking about minimum blowdown, this is the minimum for any type of exhaust. The minimum for an engine to have high power at high revs. A few degrees is a lot! The timing should always be advanced as far as possible while continuing to run well and not blow up. If you can get it running acceptably for you then you can avoid modifying the barrel but if you want it to go fast and keep the SIP road then you will need the exhaust port raised. You're going to give us some interesting results though |
|
|
|
Post by sime66 on Dec 9, 2014 11:02:52 GMT
Love that info, vespasco - very tidy. These few in-depth threads of ours are all falling into place for me now - very happy with that. Well worth all the work. |
|
|
|
Post by vespasco on Dec 13, 2014 16:44:32 GMT
Update....
Ive now fitted the 0.5mm base gasket. It took a couple hours all in all doing this and that. I didnt drop the engine, instead i wound out 3 x cylinder studs.
I also tried to make a 'shield' for my cht sensor. In the process knocking it off. The weld didnt actually penetrate the head. Nevermind. Ill just have to stick it back under the plug and prepare to keep changing them. I wasnt really happy with the way it was welded Or reading anyway. And under the plug readings are the best to take.
So hopefully, tomorrow, ill get a chance to ....
Get it finely tuned
Make some more MicroDyno runs.
Compare results from Dynos, speedo and feel.
|
|
|
|
Post by sime66 on Dec 13, 2014 18:42:02 GMT
Good man; I toyed with the idea of having a play up the dual carriageway this morning (was gonna do 4th for a giggle), but dug my box of spares out in the warm instead, to see what I could re-use for new job…… ...and, ya bugger, I've just noticed there's a load of new numbers turned up in an earlier post above; when did you slip them in!  |
|
|
|
Post by pxguru on Dec 14, 2014 5:24:33 GMT
I never noticed Vespasco's major edit either! looks like some really good work and gives the overall result I would expect. The camels hump curve is as you say. The low blowdown causes an increase in low rpm torque but a total loss of high rpm power causing the bottom end to be fatter and top rounding off too early and giving you the camels hump If the blowdown was were is should be with the exhaust port 2.5mm higher, the curve will change from the hump to a wedge shape, I would expect about 5bhp more on peak at higher rpm, slightly less torque at the bottom but the rate of rpm increase to go right up. As said a few times now will be very interesting to see on the next results with the TD higher and blowdown even lower. The camels hump should continue but me more exaggerated. Will feel like it goes better though and you might even get it where it goes good enough to stop fiddling |
|
|
|
Post by vespasco on Dec 16, 2014 21:43:05 GMT
Heres all the graphs i used above, together.... 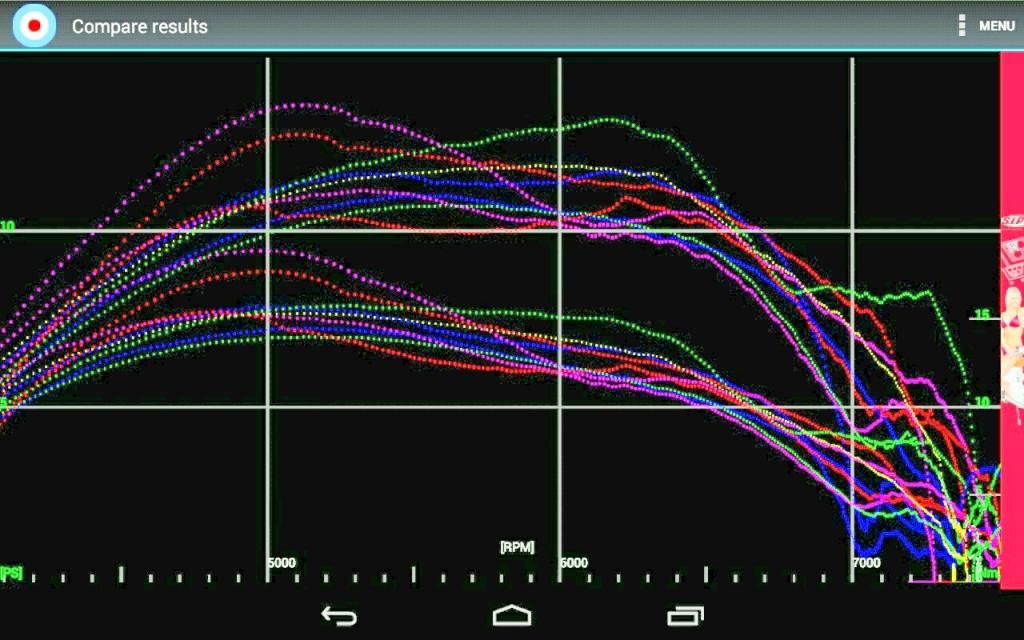 Followed by the mean....[ 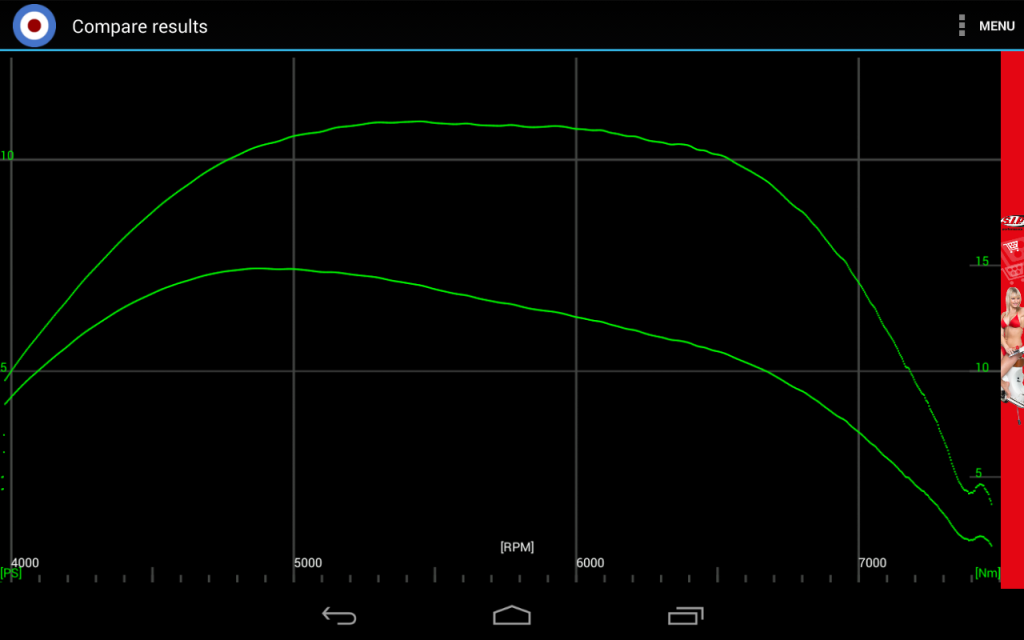 I will also post my latest runs (soon ish), just for reference, as it was windy. Im waiting for a quiet day to take some recordings since advancing?! (See "p p p p pick up" thread) gnition to 19° !! *Edit And heres the same results but with the 3 x curves with 'odd/highest' peaks omitted... 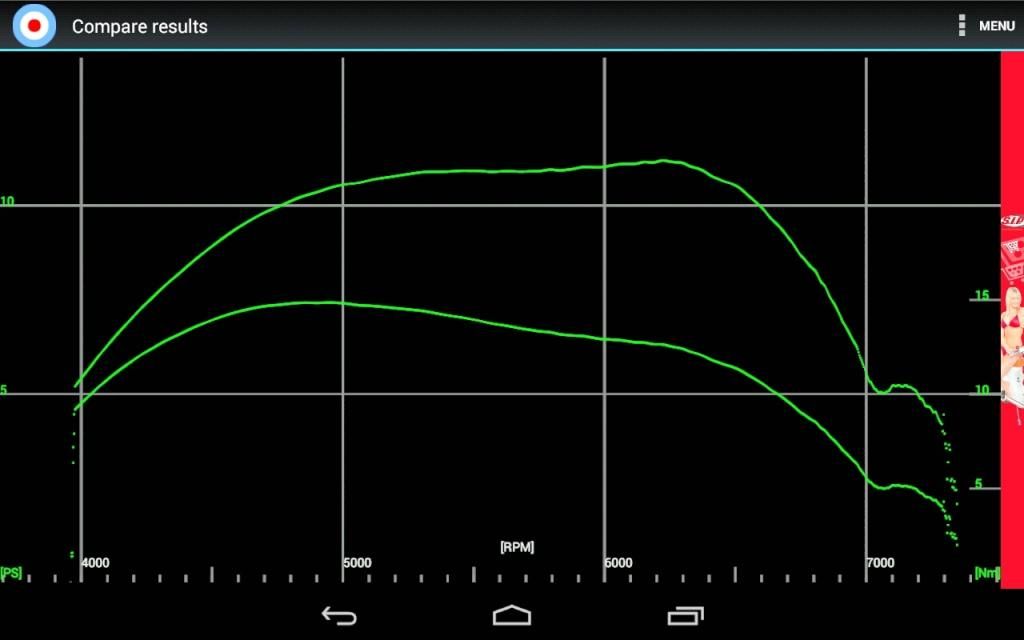 |
|
|
|
Post by vespasco on Dec 17, 2014 0:16:52 GMT
And heres the same motor, same everything, but 2 years ago... 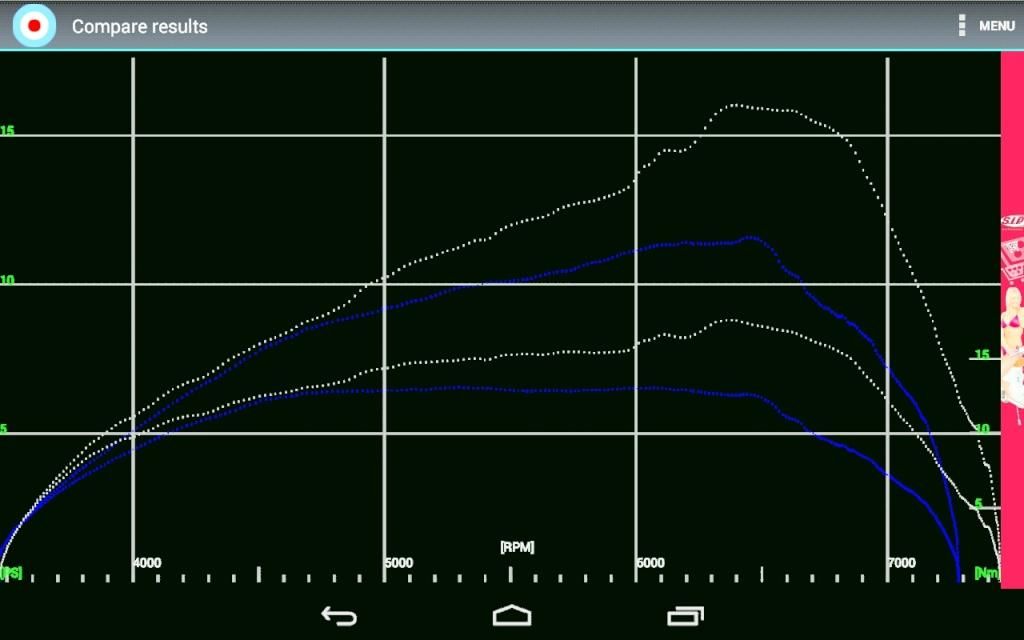 |
|
|
|
Post by vespasco on Dec 17, 2014 2:26:13 GMT
Heres your results sime... 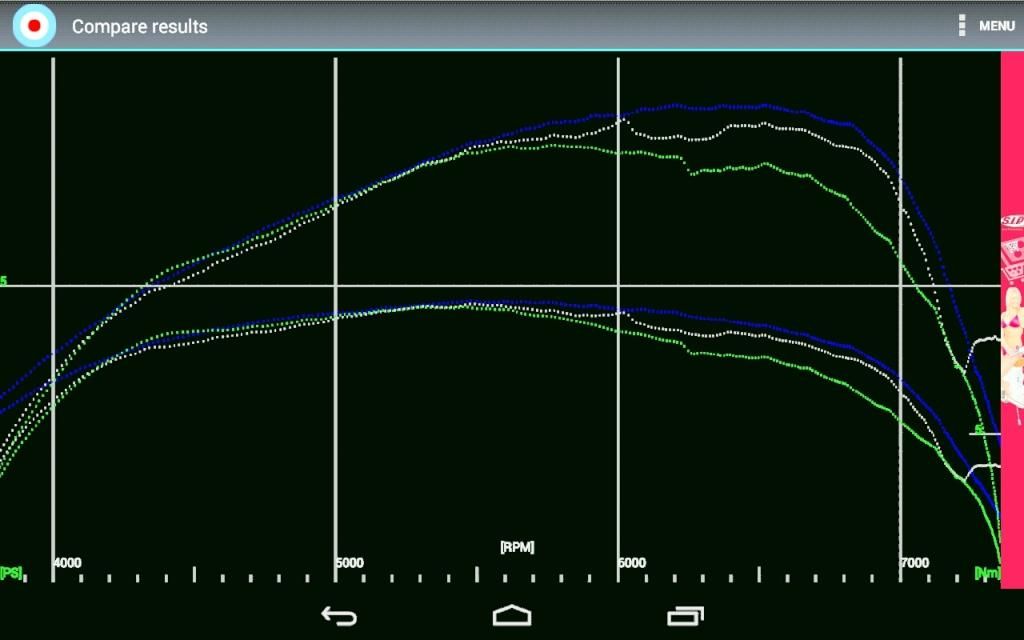 And the mean of the 3... 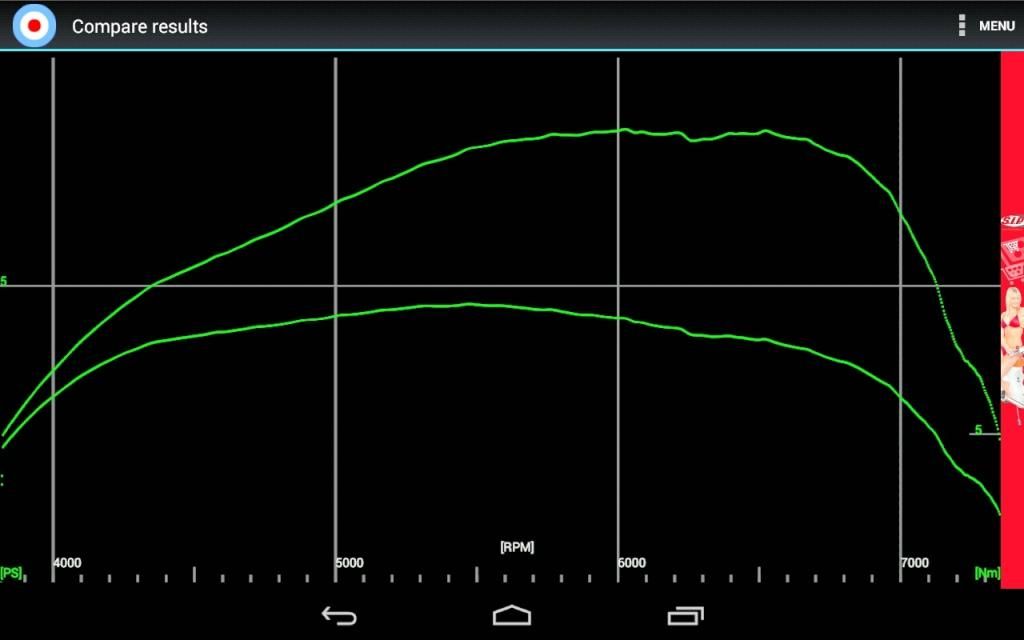 |
|
|
|
Post by pxguru on Dec 17, 2014 4:17:04 GMT
Vespasco, Looks like you've been pretty busy I saw the other charts on photobucket. The extra 0.5 on the packer did pretty much like expected, made the mid range better and high rpm worse. I really don't like the the comparison with 2 years ago. If everything on the whole set up is identical to 2 years ago then there is still a big problem somewhere. The 2 year ago curve is still not ideal shape but is much better. Did you show us this old data before? I must have over looked it. Do you have any other exhaust that works? Not important what it is, just to try something else that isn't your SR2 and see what the curve looks like. |
|
|
|
Post by vespasco on Dec 17, 2014 11:14:06 GMT
The curve from 2 years ago.... I found some old recordings on my laptop and so used them in the newly sussed microdyno. Its the first time ive seen them too!! At that time the motor was perfect for my liking. Im glad i found these recordings as it proves how my motor used to be as its been difficult trying to explain! This is why ive been asking so many questions lately... Trying to find out why, after rebuilding it the same, its not so good as before . Totally different curve. And lack of power. You see my dyno results from my recent rebuild. .... Not so good. I didnt need a dyno to tell me that. This was the main reason for me experimenting so much, trying my recent rebuilds with n without packer, trying to get it back to how it used to be!! Ive learnt a lot so its not been a waste of time. And another reason why im a little reluctant to start porting when the know it already works. (Just about anyway) That curve is possible without porting work altho' i now see from recent threads that it could be even better by raising exhaust port 2.5mm but im not necessarily looking for more revs, more power yes!! If i could just get it back to how it was!!!!?? As far as i can tell its now how it used to be. It may need a carb / ignition tweak here n there but its still essentially the same. I have a couple of exhausts i can try, albeit a Polini and a homemade SIP road style with an expanded header pipe. This was going to be my next thing to change once ive got the ignition tweaked correctly. Im hoping the pick up had slipped round a causing timing to be too retarded. (See other thread - pppppick up) So now you can see my curve from 2 years ago,,,, As ive mentioned before, it used to accelerate in 4th, from 30 - 70 mph quite easily and quickly and smoothly. It was like riding an automatic Twist n go. Even 2 up it would pull just as well. And it would max out @ 7300rpm. Which is fine as that was 73mph, fast enough for a 40year old tourer. This is what im trying to achieve! What else could it be like thats causing the loss of power!? (Ive already started a thread asking about this loss of power) Crankcases? - Old worn and cracked? Base packer? - Not quite as thick / thin as it used to be? Timing too retarded? - pick up moved. It maybe that its a combination of all these things??!! |
|


 On the last run down the bypass it topped out at 8200rpm in 4th, took about 2 minutes to get there though!


