|
|
Post by vespasco on Nov 30, 2014 2:12:32 GMT
With filter set to average readings of Nm +\-1Nm at the moment. But we can improve the accuracy i think. 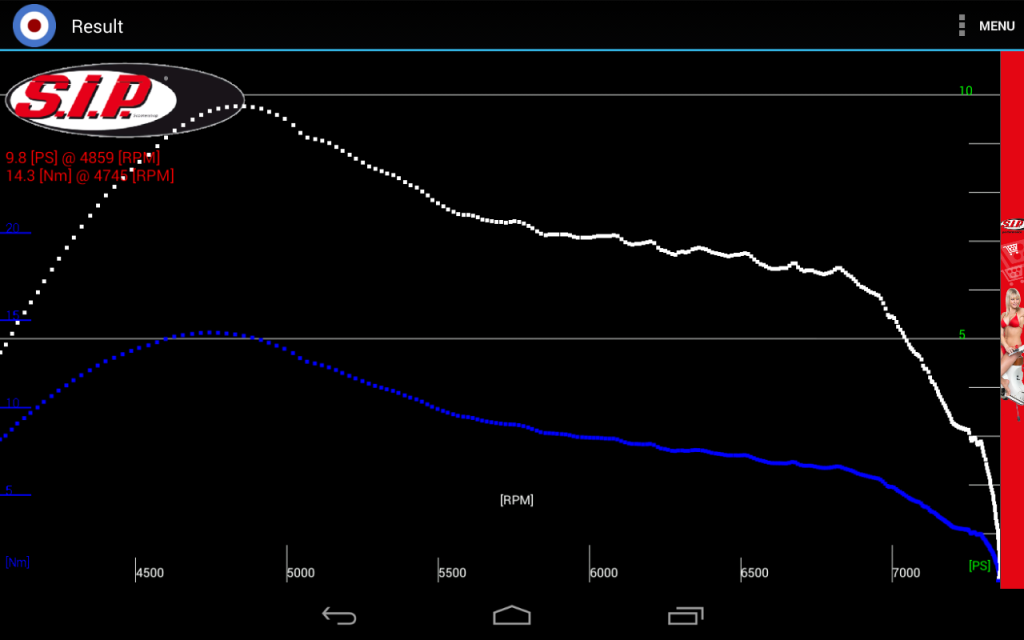 |
|
|
|
Post by sime66 on Nov 30, 2014 4:26:33 GMT
Right then, look lively; the morning shift's here - can't say if it's a lovely day or not 'cos it isn't light for another three hours.......... I did have a bit of a play last night with GSF Dyno, and joined their forum, but got a bit weighed down with translating German, but I'll go back to it. Also bookmarked an interesting forum chat on ModernVespa, where Our New Best Friend, Stefan, joins in and explains some of the work he's done developing the app, and how to go about getting decent results. You have to read down past the Naysayers to get to the worthwhile stuff, but although I haven't read it in-depth because I was Browsing all over the place, it looks like it's worth a decent read: modernvespa.com/forum/topic101980Also before I get into my post, I've noticed that the first few of your images on page 1 have gone - I went to look at your Dyno, and it aint there no more. I'm away to see if the GSF screenshots I saved are worth posting..................... |
|
|
|
Post by sime66 on Nov 30, 2014 5:16:27 GMT
……….There's more; I will post this as I have time to put it together, and as it sort of gets a similar result to yours, albeit a bit disappointing (actually, maybe not disappointing on closer inspection), and containing quite a few guesses, and being my first go at this software. I used the full wav that produced sime3, the input table had a few bits I was unsure of, so left them as GSF had them. Subject to many tweaks; here's my start point:  GSF selected the 3rd gear section (also showing me revving too high in 2nd before 3rd as we said, and which I shall correct this morning), which I tidied up a bit and erased dodgy data to make it look at what I think is the right curve:   GSF produced a very wobbly graph (due to poor recordings?), but also some output figures for PS a NM, which compare with yours - similar power, but at different revs:  I converted these figures to something that I can compare with data I have:  This is the comparison data; it shows (maybe not?) that our results are low, because I would hope to be a bit higher with DR180, 24/24e and SR2, but maybe I’m not understanding stuff properly. Actually, looking at it a bit more carefully, if I get nearer 7.2kW (your MicroDyno result), that sits nicely between PX150 and PX200, so that might look good for my scoot, and for our calcs and results – I might have another coffee!!: (I haven't got Torque figures to compare with - it's on the 'to-do' list - but again GSF is lower than MicroDyno, but close enough to be similar, and in the same area as the figures I do have for T5).  I still have a couple of hours to play/cogitate, but at 7:00am, I’m out the door to play on me scoot! I'm sure we're making mistakes as we learn, but I'm also sure that what we're doing is worthwhile, and that the App is also worthwhile, given the limitations that Stefan acknowledges he has had to impose to make it simple enough to be an App (and useable by the majority - even more of whom would dismiss it if it was more complicated) , but accurate enough not to be a waste of time if used properly. (I also love my baby a little bit more this morning). |
|
|
|
Post by sime66 on Nov 30, 2014 6:14:29 GMT
....then I read your post; I changed the filter to 2; it made a much smoother curve, which is good, but it gave a lower result, which is not so good, and which is where I decided to wait for better data (I want it to go higher, not lower!). Here they are, anyway:   (Not so happy with that one. MicroDyno is obviously superior because it gave me 9.7BHP / 7.2kW)  Being serious - we'd have to understand the front input page of GSF to get reliable results from it - I've got a lower peak here because I've smoothed out the results, which weren't clear from the wav, hence the wavy line before. We do have the technology - now we just need to learn how to use it!! BTW: Just killing time – to answer you earlier question; they have been located, and a fresh supply is on the way: www.flickr.com/photos/124362908@N02/15291633153/ |
|
|
|
Post by sime66 on Nov 30, 2014 8:40:56 GMT
Here are 4 unadulterated wavs from this morning, I also have three gps files (I lost the GPS file for one of the rides). I wanted to send them straight out the App because I want to spend some time trimming them and seeing how the GPS data works, so this gets them out quicker. I’ll also email the seven files to you (in pairs). That will definitely be it for today because: · The road is getting busy · My ‘phone is running out of space for more records (have to download these and delete when finished playing) · My clutch was getting stiff (hot?), and I’m not going to break my baby to find out how she was running just before I broke her! I’m going to leave it there for the moment to see which is best to work with, and see what we can come up with. The first two were similar, the third was fastest (but the App locked up – had to force stop it; I lost the GPS, but not the wav). The fourth was when I decided to call it a day; after the third run my clutch was stiff going back to the start point, and I missed 3rd gear in the fourth test – but continued when I found gear and completed run, but ran out of road. Here’s the wavs untrimmed shared in my Google Drive (I will email as well): drive.google.com/file/d/0Bymw3paxDl18Z3lyQXU4SGQ4N2c/view?usp=sharingdrive.google.com/file/d/0Bymw3paxDl18QjlSZXZuN1JzRjA/view?usp=sharingdrive.google.com/file/d/0Bymw3paxDl18dTEtTHdnY2JWN1E/view?usp=sharingdrive.google.com/file/d/0Bymw3paxDl18ZHRtMlBTZVdTbDQ/view?usp=sharingI think the first two, 37 & 42 wav will be the best because they have GPS data and I wasn’t fighting the clutch. I’ll do the emails………… |
|
|
|
Post by sime66 on Nov 30, 2014 10:01:31 GMT
This is going to take a bit of concentration to get the right files with their graphs; I’m trying to do a screenshot of each ride as the wav section and the curve, and put it with the cut wav file. If we decide on a wav (none of them are very strong signals, but I’ve managed to sanp to a curve easily enough), I’ll spend more time getting it neat, but the app keeps locking when I’m screeshotting, saving, re-trimming, so I’ve lost my thread a little whilst doing it. Here goes anyway: 37:  wav: drive.google.com/file/d/0Bymw3paxDl18a2lhWHBJMHhWa28/view?usp=sharing42:  wav: drive.google.com/file/d/0Bymw3paxDl18akRsWXBzMy1GWGs/view?usp=sharing46:  wav: drive.google.com/file/d/0Bymw3paxDl18RHMzaHJISHctcGc/view?usp=sharing53:  wav: drive.google.com/file/d/0Bymw3paxDl18NVZobVlJU1hjVEk/view?usp=sharingI’m not going to worry too much about trimming exactly or snapping to the correct curve accurately all the way along until we decide which, if any of the results are worth working on, so I’m done for now. I can see they need attention, but I've had six hours at it, and it's only 10:00AM. Time for a tea break............ Final note:78kmh (GPS) in 3rd is just about 7,000 rpm on the previous gear/rev/speed tables I did for my scooter before (but she ain't really happy there): 
Very last afterthought – today’s weather:
Temp 9°C
Pressure 1012mbar
|
|
|
|
Post by vespasco on Nov 30, 2014 13:44:08 GMT
[BTW....]That made me first thing in the morning !!! I nearly broke my face! Hehhehe
I ve had a v quick read through your posts but im still on my coffee. They look better already.
Ill be on it asap....
Briefly,,its the white lines on the spectrum that need smoothing out, to get a smooth reading (if ofcourse it will be a smooth reading - im sure it will be).
So does the 77km/h @approx 7000rpm seem realistic to you?
Also, on the gsf dyno, you can change the graph readouts to, for eg, rpm x km/h (and more)...how would that compare to your other results/ speeo /gps readings/gear x km/h chart ?
Ill be back!!
|
|
|
|
Post by sime66 on Nov 30, 2014 15:05:18 GMT
Glad you liked the “BTW” – I hid it in amongst the rest to see if you were reading everything – not really; didn’t want to lead this splendid thread off-topic, but was killing time waiting for sun-up! I’ll be back on it later, but I’m definitely having a couple of hours away from it at the moment after a bit of a marathon bash at it last night and this morning, but the first thing I intend to do later is to pick the best one (hopefully you’ll say which you favour), and I can work it in GSF while you work it in MicroDyno. By comparing and tweaking we might learn something about how each program is best tweaked for accuracy. I did notice that GSF is adjustable for the x & y axes; I’ve also seen how to save a loaded wav with its settings, to make it easier to go back and play with, which helps, and I can hopefully screenshot different graphs for the same clipped wav – MicrDyno is a bit temperamental (on my phone anyway), if you do a save and then continue tweaking – it throws me out and I have to go back over work. You know MicroDyno better than me, but so far I’d been thinking the white line is a sort of ‘Construction’ line whilst erasing unwanted ‘noise’, and the Green line is the one that needs to be smooth. I confess though, that the end part of it is where I’m most vague because I cannot produce final results on the free App, so haven’t spent much time on final tweaks, so I have no doubt you’re right on that. I will make myself read the tutorial again to be sure. Getting it smooth in GSF is pretty easy. I’ll better follow your questions and have some answers about GSF vs my previous calcs/tables when I’m back on it later. Should be able to do all sorts when I’ve had a bit more of a play with it. 77kmh at 7,000rpm is exactly where I’d expect to see it on my gears/rpm speed tables (it shows 78.2 on my table @ 7,000 and I got two results at 78, though I think the revs might come out a little higher in Microdyno); BUT I’m not normally staying there in 3rd, which is where I get a bit uncomfortable in revving it like that in 3rd. I’m normally changing into 4th at more like 70kmh, 6,250rpm(table) (80 on my speedo, 70 real); it demonstrably goes there though – the GPS speed proves it! Top speed ain’t power though; it’s how quick it gets there, and in some cases I was needing more than the 30s limit on MicroDyno to get my full curve, which is a bit unimpressive. Anyway, that’s my lot for a bit, but no doubt my curiosity will get the better of me before long………. Just finally (there's always an afterthought) Stefan explains the curve selection/smoothing, and the green/white lines:4. Find the right RPM curve
Usually our scooters have their max RPM at around 8000-9000 rpm. So your first look goes to the left side to find these rpm. Then look at the right side which curve has its max rpm at 8000-9000.(Sime: for tuned scoots, not mine?)You should now know which curve is the correct one. Unfortunatly its not that easy to find the right curve programmatically, so what you first do now is:
Menu(^) -> Snap
Snap: This function starts looking on the very left side of the spectrum to find the signal with maximum strength. Then it looks in a small range heading right for the next max strength signal. Please keep this in mind !
Start removing the false signals from the very left and eventually “Snap” will snap to the right curve.
If snap wont find the right curve, because on the very left side it finds a curve under the real one, then you should either go back and cut the record a little earlier, so there is a signal of your run with lower rpm
Or
Disable snap ad completely edit the spectrum by hand, removing all false signals.
The white line shows the signals which will be used for calculation.
The green line is the smoothed signal, smoothing the signal is necessary. You can play around with the filterlength on the “Edit Spectrum” screen and on the “Result” screen. The larger the filterlength, the smoother the signal will be. But unfortunately too long filterlengths will lead to a wrong result. Play around with the filter on the spectrum screen and the result screen to see what it actually does.ANDIf you turn off the filtered curve (the green line) you can see that the white line has something like a stairshape and it is noisy (some wrong signals). What the filter does is from a given signal it looks at the next few positions, takes the mean and tries to eliminate the noise + smooth the curve. (it doesnt actually use the mean for that, its a savitzky golay filter). Filterlength is just the number of positions that are considered for the "denoising" and smoothing.its a savitzky golay filter!!  |
|
|
|
Post by vespasco on Nov 30, 2014 17:13:01 GMT
Yeh im so glad its a savitzky golay, ive got all their albums!?! So, ive been playing It does take some time, flitting back and forth on my tablet but to the results... Firstly, it was difficult to get a smooth curve. Im going by how smooth i can get the white line. I think the green line thats used is the mean from the white line. Ive been using wav. ending in 46. Trimmed down to around 13 seconds at the crucial points. I've tried all other WAVs too and get similar results but it does get a bit confusing, especially when the app crashes sometimes (when saving trimmed spectrums). Its also sometimes annoying when spending ages scrubbing out unanted noise the realise ive scrubbed too much and have to start all over again. If there was an 'undo' for scrubbing erasing it wouldbe quicker. Ive tried trimming it as short as possible, and as long as possible, not a great amount of difference in the results which, according to my MicroDyno you may think a little low!? Ill send the trimmed file i used to you so you can play with it in the more 'reliable' GSF dyno to see whatyou come up with. The actual curve is not so smooth....smoother when i using a higher filter rate but as mentioned, do this too much and the results start to get clouded, so ive taken the average of PS and Nm. (PS is pretty much the same as HP) Unfortunately i could not seem to use the gps files. Ive never used gps readings as they never seem to be constant when i tried it, on my sat nav, phone or whatever... So i suggest, try the wav in GSFdyno that i will send you, it may need trimming just a touch at the end..but i think the curve maybe better to a better filter.... As good as the savitzky golay is!!!! 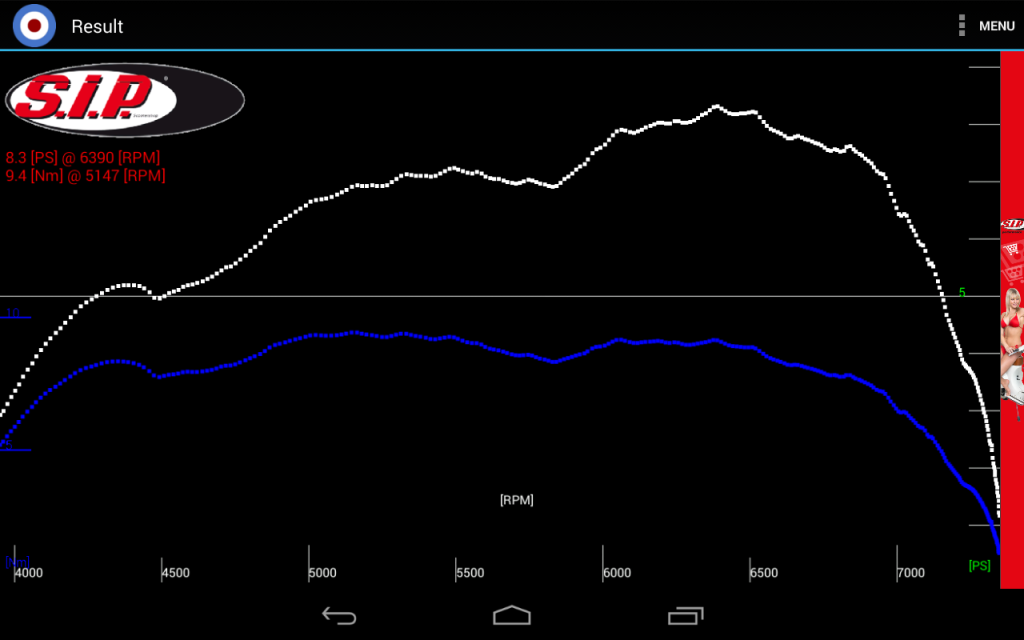 |
|
|
|
Post by sime66 on Nov 30, 2014 17:54:29 GMT
Cheers vespasco, I’ve got your email with returned wav, and will have a ponder and a play; thanks for that.
Before I go off to do that I have an observation, which might be nonsense, but I think worth saying in case it makes sense; I’ll try to explain what I mean:
· The graph you produced yesterday seems to me to be a more logical shape than the one today because the peak power is lower down the revs. Today’s one shows the peak power way up the top-end and just before max revs, which we know isn’t correct don’t we?
· It is also true that the max power values in the results yesterday tie up much more closely with the expected data in the table I posted this morning; your 9.8PS, 9.7HP, = 7.2kw sitting nicely between PX150 and PX200.
So on both those counts, on first impression, the results from yesterday’s runs make more sense to me. (Although in GSF yesterday, I got the same shape of graph as you got today – peak power higher up the revs – so we’ll see what I get today).
Having said all that, I’m sure we’ll get to the bottom of it, and I’ll get on with playing with the file you sent back to me, in the GSF dyno. I might not post anything before the morning in case I’m better sleeping on it and checking first thing, but we’ll see how sensible it looks – I feel a bit prone to making mistakes now.
It probably doesn’t matter now but the .GPS files I sent need to go in the GPS directory in SIP’s folders – you probably know that though anyway.
simesunsime46.wav is going into GSF as we speak……………………
|
|
|
|
Post by vespasco on Nov 30, 2014 18:59:51 GMT
Ok. The graph i (almost reluctantly)! used yesterday .... I say reluctantly as i had to really tweak the starting point, to get it down below 4100rpm and i think it went into the lower spectrums hotspots if you see what i mean, which id imagine would have an effct on results. But yes, it did produce a reasonable reading, with peak power lower down in the revs. Ill have another play with that file too. Im trying not to get too many files as i gets confusing on a small screen tablet. The thing i noticed, when trying to erase the small 'steps' of the white line was, its these small white line steps, which i cant eliminate effectively, (or havent been able to as yet) that make the final curve appear as it does, with two 'spikes', instead of a smoother curve. This is where the gsf dyno should be better. With the file i sent you, you will see this small , difficult to get rid of, step , at around...5500rpm on the spectrum graph....and again at around 6500rpm...see highlighted.... 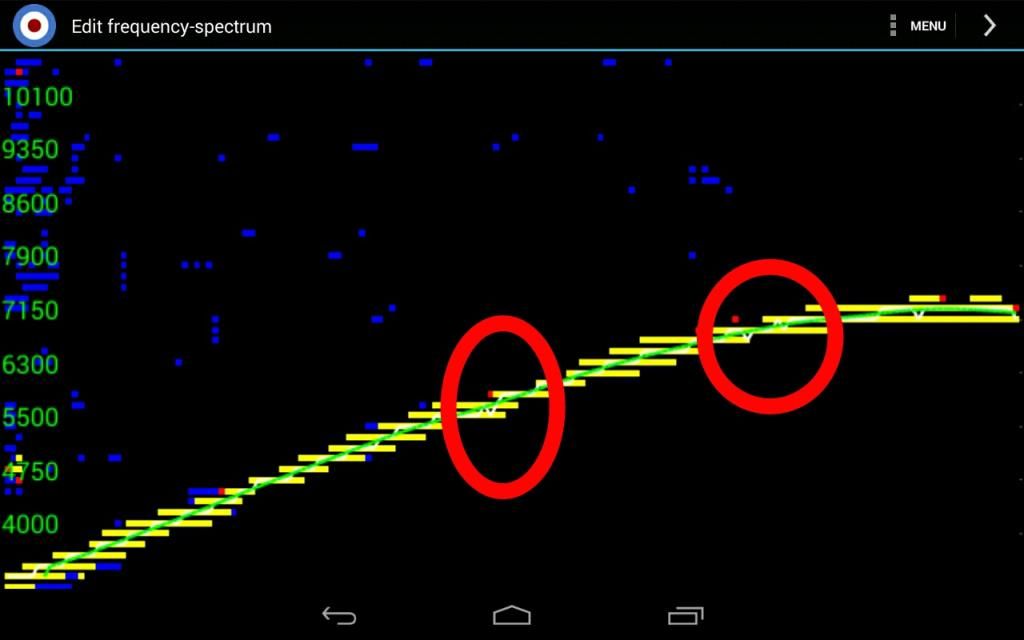 This is where i believe the gsf dyno could work better. (Filtering) Also id imagine a better quality recording would also work better, but in the real world, we dont all have those privileges and i know you'd have done all you can to get the best signal already. Do you have any other dyno results of/similar to DR180 set ups to hand? Just to have a rough compare. I ll look again for the gps folder... Probably right in front of me, and i got a bit keen to load some wavs! While i wait for your gsf dyno results ill have a go ablook for an even smoother recording to play with, no that i realise its those white line peaks that are not so good to use. |
|
|
|
Post by vespasco on Nov 30, 2014 19:03:05 GMT
Forgot the results of the above!! 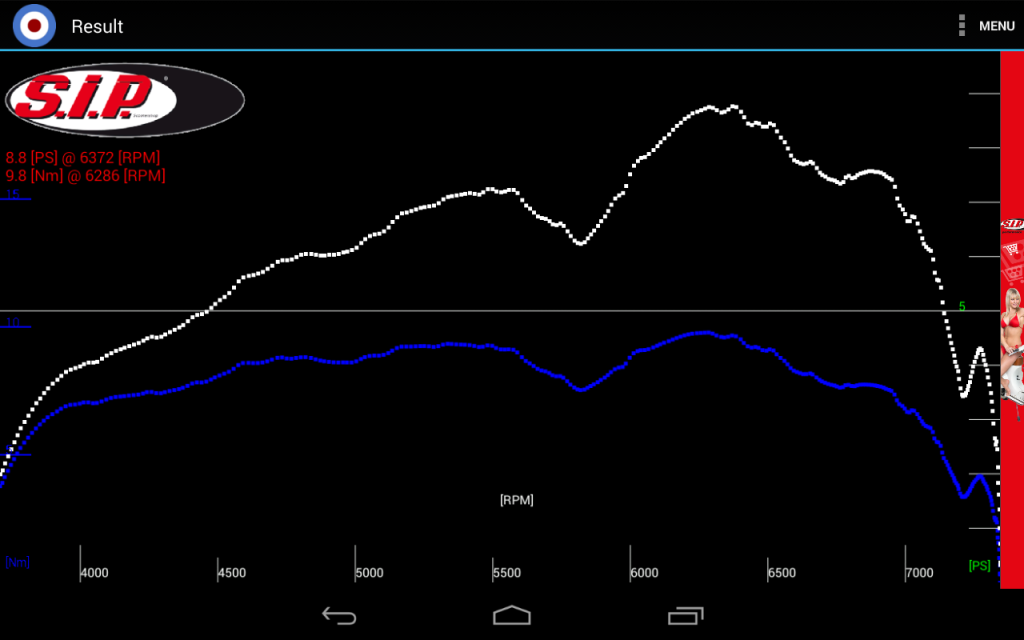 |
|
|
|
Post by sime66 on Nov 30, 2014 19:09:17 GMT
I'm getting some very nice results in GSF, if you hold off for ten minutes I'll do a big post with lots of numbers and graphs - just putting the pics with the words.........
|
|
|
|
Post by vespasco on Nov 30, 2014 19:09:56 GMT
And with full filter (factor 30) heres how the same file looks  Ill add an 'inbetween' in a sec.... |
|
|
|
Post by vespasco on Nov 30, 2014 19:17:44 GMT
Heres what id would say is an inbetween, filter @ 19 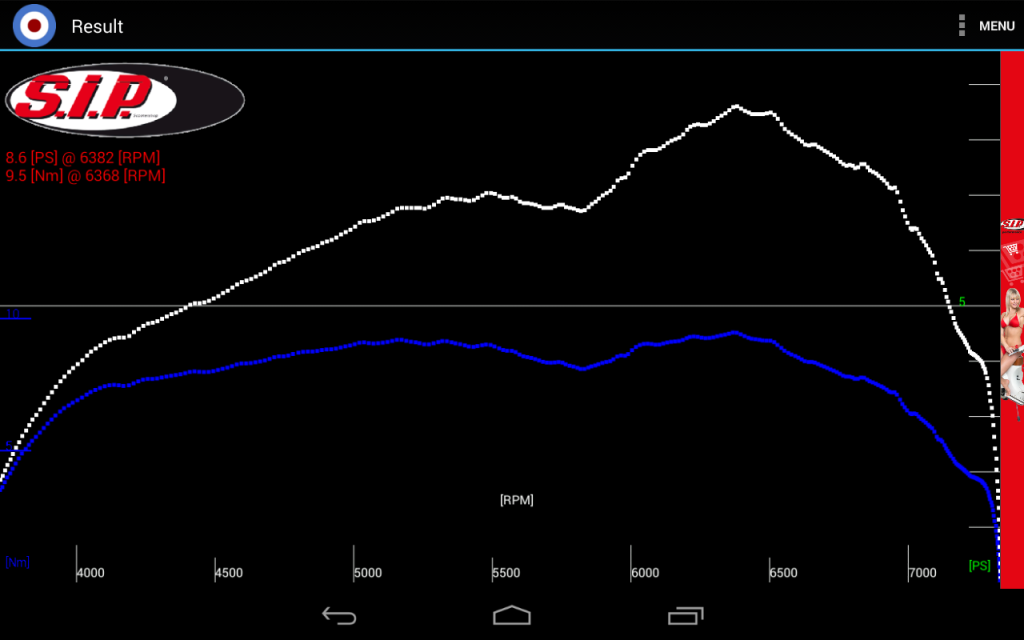 |
|
|
|
Post by sime66 on Nov 30, 2014 19:20:32 GMT
I haven’t got a super-smooth curve – distinct wobble, but I’ve got some very pleasing numbers and lots of graphs. First point to make is that the unknowns on the front page need investigating before deciding how accurate this is, but first guess looks pretty close. Brace yourself; here goes: (subject to checking in the morning, and any comments you might make before then): Front Page (settings): Wav, trimmed and snapped: Wav, trimmed and snapped: Revs – Power Nm and PS: Revs – Power Nm and PS: Revs – Power Nm and kw: Revs – Power Nm and kw: Speed – Power: Speed – Power: Speed – Revs: Speed – Revs: Time – Revs: Time – Revs: Time – Speed: Time – Speed: Time – Accelleration: Time – Accelleration: Speed - Acceleration: Speed - Acceleration: It all needs checking, the front settings page needs some work, but the kW, revs, speed etc all make sense to me and tie up with expected numbers – the graph is wobbly, and peaks at the end, but that lot above makes mr feel better about scooter and about learning GSF front page to get this software right as well as going on to working out how we get the same results out of Microdyno, which I’m sure we can. I’m going to go back and read your stuff; I was on a roll as it was coming through. This post will need an edit; I think, like you're doing, when I apply the filters to smooth the curve the max figures will drop. AND the first settings page needs investigating. (max numbers aside for the moment, when I've smoothed my curve out a bit, our two graphs are looking similar now). (Perhaps it's the torque that should be at max lower down the revs, not power - maybe one of my red herrings; trying to find a graph to compare..............) First thing tomorrow, I'll work on smoothing out the curves and then see what the max figures are. Then see what I can find out about Cd value and Rolling Friction Coefficient. |
|
|
|
Post by vespasco on Nov 30, 2014 20:11:58 GMT
*Edit: I just thought of something.. Im using Cw @ 0.8 and frontal @ 0.8 **Edit: with Cw @ 0.5 - only difference - you loose 0.1PS And 0.2 torques Thats looking better. I do actually think were getting close(r) now  Heres the same file, the filter was set to 24,,,this gave me peak power at the highest rev range i could achieve.... Also, i think youmay ge able to get a littlke smoother curve .... Try scrubbing as near as you can to your snapped line as i still think (certainly on the microdyno anyway) that it has an affect on the overall smoothness of final curve.... Heres the closest i can get to your graph. Maybe you can now get closer to this graph?! 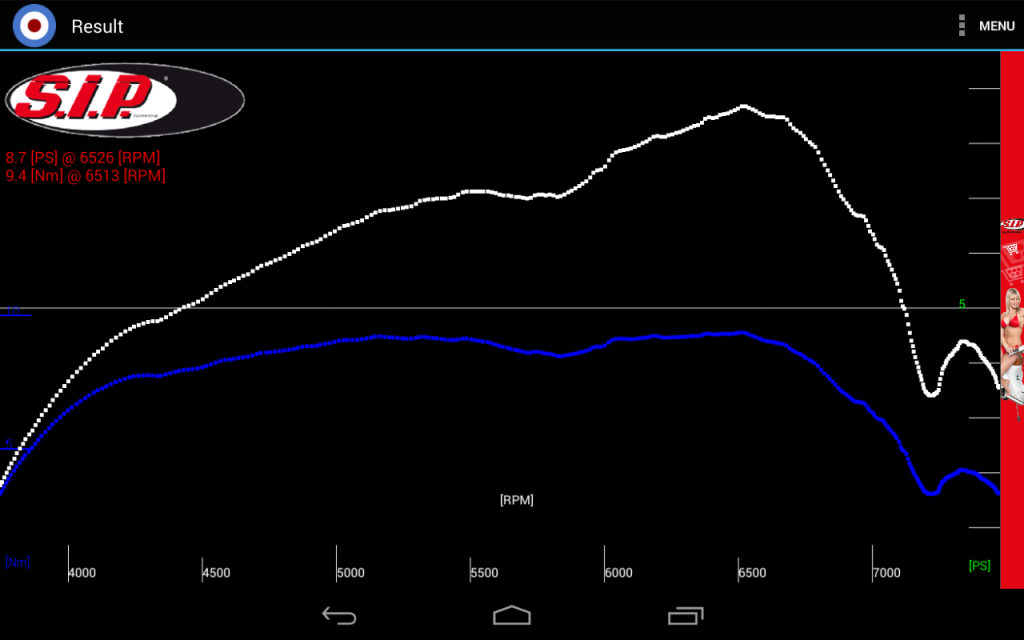 |
|
|
|
Post by sime66 on Nov 30, 2014 20:56:46 GMT
In MicroDyno yes 0.8 and 0.8 – unless we discover better. Do you think Cd in GSF is the same as Cw in MicroDyno? What about Rolling Friction in MicroDyno? Part of Cw? Maybe one for Stefan – did you hear from him? I’m going to concentrate on getting rid of my wobble – to get closer to your graph as you say – in the morning, but the actual numbers won’t be exact until I’ve sussed these unknowns in the GSF settings. Also GSF seems to save a trimmed, snapped filed as a very simple curve; to improve it you seem to have to start again; which means being more thorough to begin with. (when you actually know how best to go about it) – quite a lot of trial and error there. This is what you get when you reopen a saved trimmed, snapped wav (not much to play with):  Things will be easier to pin down when you get back on your scoot because we’ll have some idea of what we’re aiming at because of your previous results. - Which is why you did them!! I think it’s time for the early morning shift to wind-down for the evening now; I’ll get on it early again………. |
|
|
|
Post by sime66 on Dec 1, 2014 5:30:00 GMT
:oStand by your beds!!
I think we’re really getting somewhere now: 1. First job; get rid of the wobbles, so we have a similar shaped graph – sorted quite simply as it turns out by adjusting filters back to 3; some drop in peak values, but it was high anyway lastnight: 7.39kw/6887rpm - 11.98nm/5119rpm - max 7385rpm Note here, that the shape compares very well with your MicroDyno shape. It doesn’t matter that the power and torque values overlap differently; that is just due to the scale of the axes, not the values. 2. Second job; aim to get a figure for Cd that gives a feasible max power value in the results. I want to work in kw, but I’ve plotted in PS too for comparison with MicroDyno. The 7.2 kw you got yesterday seemed spot-on to me (between PX150 and PX200 on the power data I have), so that’s where I was aiming. I tried 0.8 and 0.5 – 0.5 comes out perfick (bringing kw down from 9 to 7.4) There might be a more scientific way of getting this figure, and the final power figure right, but that's the best plan I had, and seems reasonable.: 7.39kw/6887rpm - 11.98nm/5119rpm - max 7385rpm In PS for comparison with MicroDyno (bringing it down to 10PS ( using Cd=0.5, which was default in GSF)): 10ps/6887rpm - 11.98nm/5119rpm - max 7385rpm
side by side - (power shape is spot-on; torque is slightly different, but I'm happy to be this close for now): I’ll go on now to replotting the other wobbly graphs hoping to see some smooth curves in those too……….. - Can you read the numbers in the graphs and tables on your screen? Or would it help if I typed them out alongside?
|
|
|
|
Post by sime66 on Dec 1, 2014 6:19:12 GMT
Dewobbled graphs (nearly): Power and torque – time:
 Speed – time: Speed – time:
max 82.94kmh Acceleration – time: Acceleration – time: Revs – time: Revs – time:
max 7385rpm Speed – revs: Speed – revs:
max 7385rpm Acceleration – revs: Acceleration – revs:
max 7385rpm Power and torque – speed: Power and torque – speed:
7.39kw/77.34kph - 11.98nm/57.449kph - max 82.9kph Acceleration – speed: Acceleration – speed: Fairly good, but that wasn’t the purpose of the job; what I think we need to do now is see what can be done to get the numbers the same in MicroDyno without cheating – that’s assuming that the numbers in GSF are closer, which I think they are. My thinking so far is that MicroDyno is serving well as a measuring tool, but manipulating the test results is easier in GSF, but I’d be very happy to carry on working out how we can improve that by finding how best to measure(record), trim, snap, adjust settings etc in MicroDyno. We can’t really expect a new(ish) App to match desktop software that’s been developed already, but I still reckon we can improve how we’re using it. (I'm also going to get an absolutely precise measurement for my tyres and have a close look at my 'speed - revs' graph; maybe also my clutch was slipping at very high revs, which might be why it was getting stiff (hot?) - but that's my scooter, not MicroDyno). |
|
|
|
Post by sime66 on Dec 1, 2014 6:43:55 GMT
Oh bugger; of course they're identical because they're both calculated speeds, using 1355 To check my speed against revs I'd have to have a GPS speed, to check actual recorded GPS speed against speed calculated from revs in the sound test run, and unfortunately the test we're using here is the one that I lost GPS info for, so I'll have to look at another test run to do this. That will take a little longer........ (It's only recorded revs against recorded speed though, so should be easy enough - the point is that the graphs are calculated speed, not recorded). ------ That reminds me; the location of the folder for the GPS files I sent to you yesterday are as screenshot below: 
The directory is SIPHorsePowerDyno, and you will see folders - WAV for wavs, and GPS for the gps files I sent, if you're loading the wavs from a different directory then you probably just need to create a folder called "GPS" alongside it and put them there, or copy them into the one in the SIP directory. |
|
|
|
Post by sime66 on Dec 1, 2014 7:48:37 GMT
Checking recorded GPS speed against recorded (MicroDyno) revs against calculated speed for first run on Sunday – 37:
Recorded max speed on the GPS in Microdyno was 78kmh.
Recorded max revs using GSF, but from Microdyno recorded (Wav) data was 7,425rpm.
Calculated max speed (from input gear ratios and tyres) in GSF was 83.4kmh.
Actual recorded speed for recorded (Wav) revs was 5.4kmh lower at max revs in 3rd. I’m thinking, as the gear cogs are exact numbers, the loss must be at the input tyre size, or the clutch slipping.
– Or GPS inaccuracy, but I think we’re agreed that GPS is very accurate.
– Or The revs being read wrong from the Wav file, but that is very complex programming magickery; one way to test it though would be to use MicroDyno to give a max revs for run sime37. Do you fancy doing that? 78kmh would be 6,950rpm (calculated with 1355 tyre).
I have loads of tables and graphs to show the working of that lot in GSF and MicroDyno, but I don’t think, in this instance, it will make the words any clearer; there is a little discrepancy somewhere.
|
|
|
|
Post by sime66 on Dec 1, 2014 8:47:59 GMT
Last one this morning; the double bump in the power curve – I’m not so sure its wrong:This is a DR177 curve I found earlier, unfortunately the page no longer exists, but it still came up as an image in a search:   This also is from scootering, when they did the comparison of exhausts. As best I can gather from reading quickly, this is a px125 (blue line), and then with a Malossi 166 (green line) - I don’t know why the label says 180 - anyway, you can see the double bump again with he Sip Road 2:   It’s the extra low-down grunt with dr180 and Sip Road 2 – that I like for all the bleedin’ hills round here! That's my theory anyway; and I'm sticking to it until someone comes up with a better one!
|
|
|
|
Post by vespasco on Dec 1, 2014 9:39:23 GMT
Very briefly, as im on my phone and cannot see the numbers,
I will aim for the 6875rpm(or whatever it was. I cant see It now) and use run 37, with rhe gps at 78kmh
I was wondering what your max was/is. That should help improve accuracy.
7400+rpm is too high.
A little aside here: sip road - do you think they are limited to 73/7400rpm? And do you think its the exhaust at around 4500rpm - 5500rpm that lacks a little power?
I did wonder if the spikes are indeed your motor. And mine come to that. But looking at spectrums its in the ranges where the signal is not so clear / lots of interference where the dips in the curve appear.
I think the results can only be as good as the recording.
But for accuracy, in micro dyno at least, i dont tjink the curve should be smoothed out too much, as thats mot what we started with.
Ill play some more with 37
Ive been playing with an old wav file i found, of my pinasco.
I can get this wav file, depending on how i edit it , and twhich filter i use, to +\- 5PS !! Quite a lot! But some of that can be dismissed as me pushing up the green line and using wrong filter.
So this is also what im trying to 'smooth out'!
Ill get cracking soon enough.
Coffee. I need coffee
|
|
|
|
Post by sime66 on Dec 1, 2014 10:36:55 GMT
I’m not sure the 7,400 is the result of anything I’ve done; isn’t it the curve on the wav alone that dictates the max revs that the program picks up? – I do agree that improved recording techniques will help, which might well make a difference to that too. Do you think it is just wrong (bad data/recording) then if there is a signal on the wav (the selected curve, which is the correct one) that says 7,400? I don’t have the knowledge to answer your question about SR2 max power here and now, but I will find out. I do recall reading something Stefan said about the exhaust changing it’s characteristics/performance/effect at high revs – there’s a word he used – it may be the noise I was hearing when riding – a sort of blow-back/flapping/puffing?- I’ll try to find it to see if it’s relevant. In my mind there’s lots of things limiting my revs, some of which we’ve covered in recent threads; I’m not really thinking about what’s limiting it, more what it’s actual limit is to get feasible results– it’s already higher than I was expecting. The business about the adjustability of the results and making them read what we want them too, isn’t such a drastic worry from my point of view; because once we have a method that achieves results that we can agree are expected for the engine/exhaust etc. we are using (yours or mine doesn’t matter which we work on now), then as long as that method is repeatable and followed every time then the precise CHANGES (after engine tweaks for example) are what we’ll be looking for rather than the precise NUMERIC RESULTS. Now, I’m out all day, will keep an eye on the forum from mobile. Before I go I've put some numbers on the graphs to help read them. I must dash out; just a quick look to see if I can find what stefan wrote about exhausts............ This is it; he was talking about 'Holes' in the data due to exhaust resonance. i have no idea if that is relevant to either the exhaust being a limit, or the data having bits distorted/missing, but there it is anyway: modernvespa.com/forum/topic101980: |
|
|
|
Post by vespasco on Dec 1, 2014 11:41:35 GMT
Using file 37 , the trimmed version, which i will email to you..... Heres what i came up with, no cheating,...im a bit more experienced at scrubbing the spectrun now! Using the low filter, 16, which should be more accurate too. I can 'adjust' the rev range a little (to max 200rpm more - 5458rpm) for the torques which gives 9.6Nm but it has little affect on the PS (8.0 @ 6537rpm). Which also makes me think this file / result is more accurate? Adjusting filter to a smoother curve (higher filter but less accurate) gives lower results. The dip is more exaggerated in microdyno with little/low value filter but results are close and with little 'adjustment'. The max gps speed still gives out 78kmh but you cant plot it, its just a reading that pops up. 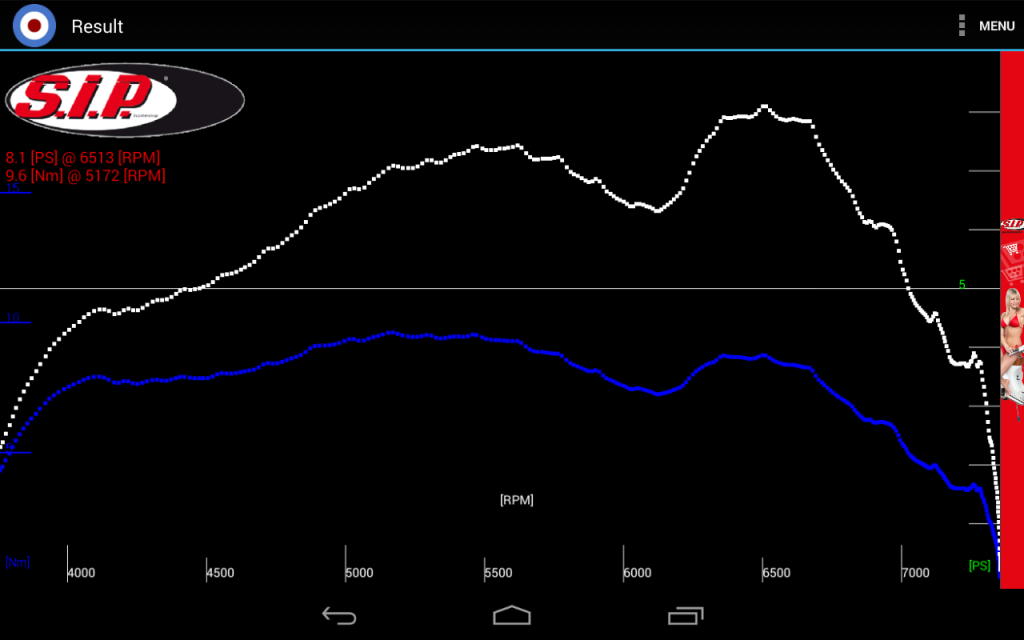 Hopefully i maybe able to actually physically test mine soon?!?!!!! Having a rev counter and digital speedo will come in v handy!!! |
|
|
|
Post by sime66 on Dec 1, 2014 15:33:10 GMT
I’ve got two posts on the go; and the Internet is playing up today, which might mean it’s going to die for a while, so I’m just going to post these as they are, and hope to be able to read replies; if I go quiet for a while it’ll be because the Internet is down. I hope you continue posting, and that I can stay on it, or at least see yours. Might be nothing, but it’s gone like this before; it slowly dies, is down for a day or so, and slowly comes back. i've still got my 3G dongle if I get desperate, but that went for a bit last time too. It's what you get for living on England's foreskin!
I’m going to put sime37 into GSF any tick of the clock………..(done it now)
I don’t expect it to be different to the results I got this morning because it’s the same source curve and the same settings, but it might answer one of the questions below whether it comes out the same or different. Before post do that though, here’s some thoughts during the day:
We’re at a bit of a stumbling block here at the moment.
I see nothing wrong with my figures or results; I haven’t tweaked anything, or used unlikely settings; I’ve got a real ride that produces sensible results – unless you are sure that the revs I’m getting is definitely wrong. I see no problem with any of it – power, speed etc., is lovely.
BUT
You’re using the same data, and agreed settings on the front page (apart from weather, but I don’t imagine that’s significant), and you’re our expert in MicroDyno for scrubbing, snapping and cropping etc., but you’re getting lower results.
So the question is why are we getting different results from the same data? Regardless of the quality of the recording, we are both using it, so it isn’t that. It has to be either the method of cropping, scrubbing, snapping OR the front Settings data; maybe those queries I raised last night about Cd – Cw and Rolling Friction Coefficient? (But if it’s those, why am I getting such good results by just using the default values in the two ones where I’m unsure?
I’m a bit stumped just for the moment, but I agree we’re making good progress; just a hurdle.
Things to take on board:
· Weather: 9°C, 1013mbar on Sunday. – I think you’re using Saturday.
· You can’t compare runs sime46 with sime37 directly. sime46 was a better run (smoother, longer, faster), I’d expect the results to be higher in that one. You can’t say one is more accurate than the other by the final figures alone, but by the quality of the signal you can. I think they’re both accurate, but different because the run was different.
· In GSF I don’t (haven’t been) removing all unused lines, just making sure the picked smooth line follows the curve I want it to (I have screenshots from this morning, but more images wouldn’t have made it clearer in the post). I will remove ALL unwanted lines in the next one to see if it makes a difference. I don’t think it will because when I reload a saved file it is just a smooth single curve. I think that may be more crucial in MicroDyno, which I haven’t done it much in because I haven’t got the results page in my free version. You do seem to be having much more of a struggle getting a smooth curve in MicroDyno than I’m having in GSF. Maybe GSF is better at it, or maybe MicroDyno is more accurate; I do not know which. I don’t feel inclined to change what I’m doing in GSF because my results seem correct; obviously I will if you can show me why they’re wrong – as opposed to just different to your MicroDyno results.
· If, as we seem to be thinking now, the exhaust resonance is making holes in the recorded data, what’s the way round that?!
I reckon we should invite Stefan to join in our forum like he did with the Modernvespa blokes.
(And knock out a few freebies while he’s here, so I can play with the real one! – at the moment using MicroDyno for recording and then GSF for the results is looking good to me, but I’m prepared to change that opinion).
|
|
|
|
Post by sime66 on Dec 1, 2014 15:33:39 GMT
|
|
|
|
Post by vespasco on Dec 1, 2014 16:36:46 GMT
quickly again... (i have the luxury of using a proper pc and broadband so i may end up writing more than i bargained for as its soooo much quicker)
ive also had a play on gsf with the same file, obviously i get the same results as you...ill keep playing, but its more than likely the GSF is going to be more accurate...its just a matter of getting the Microdyno to match it!!
The small concern i may/not have is the max revs and speed in the results....
am i correct in saying your readings, on your scooter, were top speed 78kmh?
And max revs , according to the gear chart, would be 6950rpm?
If so, this is the only discrepancy i can see in both apps....ie....max revs showing ' 7405rpm'
giving top speed of 82kmh
im trying to see if i can 'end' the curve sooner, trying to achieve a top speed (on both apps) of 78 @6950rpm.... when i see those results i will be happier.
Between the 2 apps, i think we have matching rpms, which is a good start...
we also have same 7400rpm as max
which would , by calculating give same top speeds..
I will try to shorten the wav file a little more, to see what effect it has on results..
the Cw value on GSF makes a bit of difference too!
If i could ride my scooter and i had a decent pc and broadband we'd have probably sussed it by now..... but ill stick at it ... as i want to do my scooter next ... whenever i can ride it!!
ill have another play while i have use of both apps and add more soon/later
|
|
|
|
Post by sime66 on Dec 1, 2014 16:53:52 GMT
I’ve still got the internet at the moment, but it keeps coming and going, so I’ll be quick; if you lose me for a bit, just carry on and I’ll jump in when the connection allows: That’s great progress that you agree GSF is OK, and we need to work out how to make MicroDyno match it – that’s were I’d got to, except I thought getting you to agree might be tricky. If I had the full MicroDyno app, that's what I'd be working on now. Yes exactly, the max GPS for the ride was 78kmh, which is equivalent to 6,950 – correct. My gear chart is posted earlier this morning ^^ Putting the Cd to 0.8 made the results higher, which is why I left it at 0.5 (default), while I try to find out if it is the same as Cw and what Rolling Friction Coefficient is and where it is allowed for in MicroDyno. It might be that Cd + Rolling Friction Coefficient = Cw, which would explain a lower Cd in Gsf and no rolling Friction Coefficient in MicrDyno. - It's as good a theory as any at the moment. Also make sure of weather settings!
....and be patient! - we only got the first test run readings on Saturday morning, and we've nearly cracked it. Getting it right is more important than getting it quick! (You need to get that leg sorted and get on your scooter don't you). Going to post that now, while I have connection, and hopefully add to it/tidy up later. Keep posting; I can work offline and post when Internet allows. |
|


